. 2006 Apr 1;20(7):858-70.
doi: 10.1101/gad.1399406. Epub 2006 Mar 17.

Chromosome-wide gene-specific targeting of the Drosophila dosage compensation complex

Affiliations

Chromosome-wide gene-specific targeting of the Drosophila dosage compensation complex

Gregor D Gilfillan et al. Genes Dev. .

Abstract

The dosage compensation complex (DCC) of Drosophila melanogaster is capable of distinguishing the single male X from the other chromosomes in the nucleus. It selectively interacts in a discontinuous pattern with much of the X chromosome. How the DCC identifies and binds the X, including binding to the many genes that require dosage compensation, is currently unknown. To identify bound genes and attempt to isolate the targeting cues, we visualized male-specific lethal 1 (MSL1) protein binding along the X chromosome by combining chromatin immunoprecipitation with high-resolution microarrays. More than 700 binding regions for the DCC were observed, encompassing more than half the genes found on the X chromosome. In addition, several rare autosomal binding sites were identified. Essential genes are preferred targets, and genes binding high levels of DCC appear to experience the most compensation (i.e., greatest increase in expression). DCC binding clearly favors genes over intergenic regions, and binds most strongly to the 3' end of transcription units. Within the targeted genes, the DCC exhibits a strong preference for exons and coding sequences. Our results demonstrate gene-specific binding of the DCC, and identify several sequence elements that may partly direct its targeting.


Figures

Figure 1.
Figure 1.
Genome-wide MSL1 binding as revealed by ChIP hybridization to a cDNA array. Arms of the Drosophila chromosomes are shown above a scale in megabases. The Y-axes represent the log2 of the MSL1 ChIP enrichment ratios over mock IP. Each bar represents a cDNA on the array. The standard deviation between the four replicate experiments is depicted by gray error bars. Genes that were significantly bound by MSL1 are colored red (p < 0.01).
Figure 2.
Figure 2.
MSL1 and RNA pol II ChIP hybridization to tiling array. Representative 200-kb sections of the X chromosome (A) and chromosome 3R (B). MSL1 and RNA pol II data are the log2 signal ratio of specific IP/input for each oligonucleotide on the array. Each oligonucleotide of the array is represented by a single vertical bar and colored when signal rises above threshold. Data are the mean of three independent ChIP experiments. The entire data set can be browsed at http://wpl054.bio.med.uni-muenchen.de/cgi-perl/gbrowse/genome1.
Figure 3.
Figure 3.
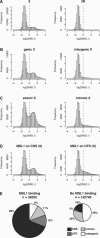
MSL1 binds primarily to coding sequences. Signal distribution (array oligonucleotides) of MSL1 enrichment in defined genomic sequences on custom tiling array. MSL1 binding to X and 3R chromosomes (A), genes and intergenic sequences on the X chromosome (B), exons and introns on the X chromosome (C), and coding sequences and 5′/3′ untranslated regions on the X chromosome (D). Oligonucleotides to the right of the dotted line were considered to be MSL1 binding. (E) Summary of genomic features in MSL1-binding and nonbinding oligonucleotide categories. (CDS) Coding sequence; (UTR) 5′ and 3′ mRNA untranslated regions.
Figure 4.
Figure 4.
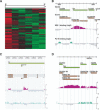
The majority of DCC-binding genes show a 3′ accumulation of MLS1. (A) MSL1 binding along genes is skewed toward the 3′ end. Three-hundred-thirty-four nonoverlapping genes with robust MSL1 binding (average log2 ratio >0.5) and a length >2 kb were aligned and divided into six segments. The average MSL1 binding of each segment above (green) or below (red) the average binding of the gene is depicted as a heat map. The genes were hierarchically clustered and vertically ordered based on the signal distribution pattern. (B) The Rbf gene shows strong 3′ MSL1 binding. (C) The bias for exons is easily seen on longer genes such as Smr. (D) Coating of genes exemplified by the Cap and crl genes.
Figure 5.
Figure 5.
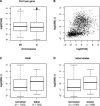
Relation of MSL1 to RNA pol II binding and gene function. (A) Boxplot comparing levels of pol II per gene on the X and 3R sequences from the tiling array. (B) Scatterplot of MSL1 binding data against pol II binding on X-chromosomal genes. Note that two populations are visible. In the population binding MSL1 (those with log2 values >0), there is no correlation between the amount of MSL1 and the amount of polymerase on a gene. (C) Boxplot showing increased MSL1 levels on X-chromosomal genes with growth defects identified on RNAi (RNAi lethal genes with z scores >1) (Boutros et al. 2004); two-sided t-test, p-value: 4 × 10⁻⁹. (D) Boxplot showing MSL1 levels correlated to X-chromosomal genes with essential alleles listed on FlyBase (http://www.flybase.org); two-sided t-test, p-value: 2.2 × 10⁻¹⁶.
Figure 6.
Figure 6.
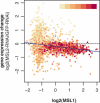
MSL1 binding correlates with dosage compensation. Gene expression data following RNAi of MSL2 in SL2 cells (Hamada et al. 2005) were correlated to embryonic MSL1 binding (tiling array data set). MSL1 targets (genes with mean MSL1 log2 ratios >0) show a drop in expression upon knockdown of MSL2 (Wilcoxon rank sum p-value: 2.2 × 10⁻¹⁶). In addition, high levels of MSL1 binding correlate with the greatest loss of dosage compensation after MSL2 knockdown, as can be seen by the negative slope of the MSL1 targets (the least squares regression line for MSL1 targets is indicated in blue; slope −0.12, p-value: 2 × 10⁻¹⁰). Genes have been colored for absolute expression level measured in SL2 cells: (dark red) high expression; (yellow) low expression. No linear relation exists between MSL binding and absolute expression level.
Figure 7.
Figure 7.
Sequence motifs have a role in DCC targeting. A 4-Mb section of the X chromosome and 1 Mb of 3R were used as a training set to describe DCC binding by a PLS regression. The regression model comprising three components was then applied to predict DCC binding on a further 350-kb section of the X chromosome (A) or 3R(B). Measured DCC binding from the tiling array is shown in the same figures for comparison. (C) The 10 top-scoring sequence motifs within the individual components (comp1–comp3) are listed. The 10 motifs with the most positive combined regression coefficients from all three components are shown (Top 10).

References

    1. Adams M.D., Celniker S.E., Holt R.A., Evans C.A., Gocayne J.D., Amanatides P.G., Scherer S.E., Li P.W., Hoskins R.A., Galle R.F., et al. The genome sequence of Drosophila melanogaster. Science. 2000;287:2185–2195. - PubMed
    1. Akhtar A., Becker P.B. Activation of transcription through histone H4 acetylation by MOF, an acetyltransferase essential for dosage compensation in Drosophila. Mol. Cell. 2000;5:367–375. - PubMed
    1. Alekseyenko A.A., Larschan E., Lai W.R., Park P.J., Kuroda M.I. High-resolution ChIP–chip analysis reveals that the Drosophila MSL complex selectively identifies active genes on the male X chromosome. Genes & Dev. 2006 (this issue) - PMC - PubMed
    1. Arbeitman M.N., Furlong E.E., Imam F., Johnson E., Null B.H., Baker B.S., Krasnow M.A., Scott M.P., Davis R.W., White K.P. Gene expression during the life cycle of Drosophila melanogaster. Science. 2002;297:2270–2275. - PubMed
    1. Baker B.S., Gorman M., Marin I. Dosage compensation in Drosophila. Annu. Rev. Genet. 1994;28:491–521. - PubMed

Publication types

LinkOut - more resources