. 2006 Apr 1;20(7):848-57.
doi: 10.1101/gad.1400206. Epub 2006 Mar 17.

High-resolution ChIP-chip analysis reveals that the Drosophila MSL complex selectively identifies active genes on the male X chromosome

Affiliations

High-resolution ChIP-chip analysis reveals that the Drosophila MSL complex selectively identifies active genes on the male X chromosome

Artyom A Alekseyenko et al. Genes Dev. .

Abstract

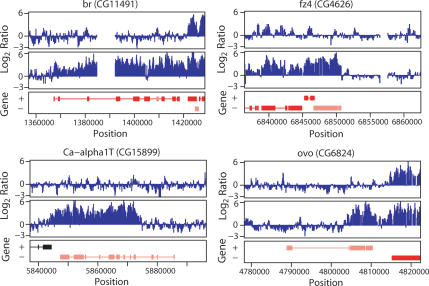
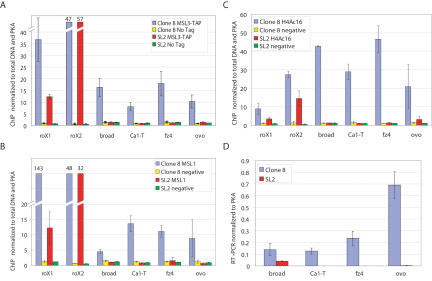
X-chromosome dosage compensation in Drosophila requires the male-specific lethal (MSL) complex, which up-regulates gene expression from the single male X chromosome. Here, we define X-chromosome-specific MSL binding at high resolution in two male cell lines and in late-stage embryos. We find that the MSL complex is highly enriched over most expressed genes, with binding biased toward the 3' end of transcription units. The binding patterns are largely similar in the distinct cell types, with approximately 600 genes clearly bound in all three cases. Genes identified as clearly bound in one cell type and not in another indicate that attraction of MSL complex correlates with expression state. Thus, sequence alone is not sufficient to explain MSL targeting. We propose that the MSL complex recognizes most X-linked genes, but only in the context of chromatin factors or modifications indicative of active transcription. Distinguishing expressed genes from the bulk of the genome is likely to be an important function common to many chromatin organizing and modifying activities.


Figures

Figure 1.
Figure 1.
MSL3-TAP protein targets the male X chromosome. (A) Genomic MSL3-TAP fusion construct. (BE) Immunofluorescence in which the TAP epitope is recognized by the PAP antibody (red) and DNA is stained with DAPI (blue). (B) Immunostaining of male polytene chromosomes in the absence of endogenous MSL3 protein. (C) Immnostaining of male polytene chromosomes when both MSL3-TAP and wild-type MSL3 are present. (D) Immunostaining of MSL3-TAP SL2 cells, in which the fusion protein can be seen localized to a subnuclear region. (E) The MSL3-TAP signal is absent in untagged wild-type SL2 cells.
Figure 2.
Figure 2.
High-resolution ChIP–chip analysis of MSL3-TAP binding to chromosomes X and 2L. (Top) X chromosome. (Bottom) Chromosome 2L. A 180-Kb section is shown for each, representing the hybridization to ∼1800 50mers, or ∼0.5% of the total data set. For each chromosome, results from one experiment, a corresponding dye-swap, and a second independent experiment are aligned above the gene annotation for each segment. Genes expressed from left to right are shown above genes expressed from right to left. Rectangles represent exons, connected by lines that represent introns. Red genes are expressed while black genes are not expressed as determined by Affymetrix analysis of SL2 cells. MSL binding is enriched on the X chromosome over expressed genes.
Figure 3.
Figure 3.
Analysis of the link between MSL binding and transcription. (A) The average MSL-binding profile over bound and unbound genes. Genes of differing lengths were scaled to align 5′ and 3′ ends. The average bound profile covers the gene body, with stronger binding toward the 3′ end. (B) Relative fractions of bound, intermediate, and unbound genes that were transcribed (blue) or were not transcribed (pink) by Affymetrix analysis. (C) Relative fractions of transcribed genes and nontranscribed genes that were clearly bound (dark green), intermediate (light green), and clearly unbound (yellow) by MSL3-TAP ChIP–chip analysis. (D) Comparison of expression state and MSL binding. Genes were divided into quantiles by increasing Affymetrix expression values, and graphed to show the percent of genes in each quantile that were clearly bound by MSL complex in ChIP–chip analysis. Quantiles containing nonexpressed genes are labeled in pink, and quantiles with expressed genes are labeled in blue. Once genes reach a threshold expression level, the probability of robust MSL binding does not increase with increased expression. (E) Comparison of the effect of RNAi depletion for MSL2 (Hamada et al. 2005) on expression level of transcribed genes that are bound by MSL complex (red) versus transcribed genes that are clearly unbound (green). Genes on chromosome 2L show no effect of MSL2 depletion (gray).
Figure 4.
Figure 4.
The MSL-binding pattern is largely common to late-stage embryos and two cell lines, but is not invariant. (A) Venn diagram showing the relationships between genes bound by SL2 cells (red), Clone 8 cells (blue), and embryos (green). This is a conservative number, as only the clearly bound genes are considered, while intermediate genes are not included in the totals. (B) Fourteen genes were identified as clearly bound in Clone 8 cells and clearly unbound in SL2 cells. Their normalized expression levels are shown on the left, ordered by the log fold ratios between the cell types, listed on the right of the heat map. The expression levels are higher in Clone 8 cells in all cases, except CG4040, which had low transcription resulting in an unreliable fold ratio (see Supplementary Table 2). For the two genes identified as clearly bound in SL2 and unbound in Clone 8, expression levels are much higher in SL2. The density plot shows that the distribution of log fold ratios for all genes is centered at zero and that the ratios observed here are not due to an overall shift.
Figure 5.
Figure 5.
Sequence alone is not sufficient to specify MSL binding. Examples of ChIP–chip tiling along four genes that were bound in Clone 8 cells but clearly unbound in SL2 cells. (Top profiles) SL2 cells. (Bottom profiles) Clone 8 cells. Gene annotation as in Figure 2. The central gene is the one of interest in each case. Note that in br and fz4 the whole genes appear covered by MSL binding, while the Ca-α1T and ovo genes show strong enrichment over the 3′ portions and no MSL complex detected over 5′ regions.
Figure 6.
Figure 6.
Differentially bound genes are differentially acetylated at H4Ac16 and differentially transcribed. (A) ChIP of MSL3-TAP binding to br, Ca1-T, fz4, and ovo confirms that these genes are differentially bound. Real-time PCR was used to quantify ChIP DNA, thereby validating the ChIP–chip studies. We show the average and standard deviations from three independent chromatin preparations, with roX genes assayed as positive controls. (B) ChIP using a polyclonal antibody against MSL1 shows that MSL3-TAP and MSL1 binding are similar at this subset of genes. (C) ChIP using an anti-H4K16ac antibody indicates that differentially bound genes are differentially acetylated, as expected for MSL targets. (D) RT–PCR analysis was used to validate the differential transcription data acquired from Affymetrix arrays. The absence of visible bars for SL2 cells (Ca1-T and fz4 genes) is due to low mRNA levels of these transcripts.

References

    1. Bai X., Alekseyenko A.A., Kuroda M.I. Sequence-specific targeting of MSL complex regulates transcription of the roX RNA genes. EMBO J. 2004;23:2853–2861. - PMC - PubMed
    1. Bone J.R., Lavender J., Richman R., Palmer M.J., Turner B.M., Kuroda M.I. Acetylated histone H4 on the male X chromosome is associated with dosage compensation in Drosophila. Genes & Dev. 1994;8:96–104. - PubMed
    1. Carrozza M.J., Li B., Florens L., Suganuma T., Swanson S.K., Lee K.K., Shia W.J., Anderson S., Yates J., Washburn M.P., et al. Histone H3 methylation by Set2 directs deacetylation of coding regions by Rpd3S to suppress spurious intragenic transcription. Cell. 2005;123:581–592. - PubMed
    1. Copps K., Richman R., Lyman L.M., Chang K.A., Rampersad-Ammons J., Kuroda M.I. Complex formation by the Drosophila MSL proteins: Role of the MSL2 RING finger in protein complex assembly. EMBO J. 1998;17:5409–5417. - PMC - PubMed
    1. Currie D., Milner M., Evans C. The growth and differentiation in vitro of leg and wing imaginal disc cells from Drosophila melanogaster. Development. 1988;102:805–814.

Publication types

MeSH terms