. 2006 Mar 17;34(5):e42.
doi: 10.1093/nar/gkl050. Print 2006.

An improved single-cell cDNA amplification method for efficient high-density oligonucleotide microarray analysis

Affiliations

An improved single-cell cDNA amplification method for efficient high-density oligonucleotide microarray analysis

Kazuki Kurimoto et al. Nucleic Acids Res. .

Abstract

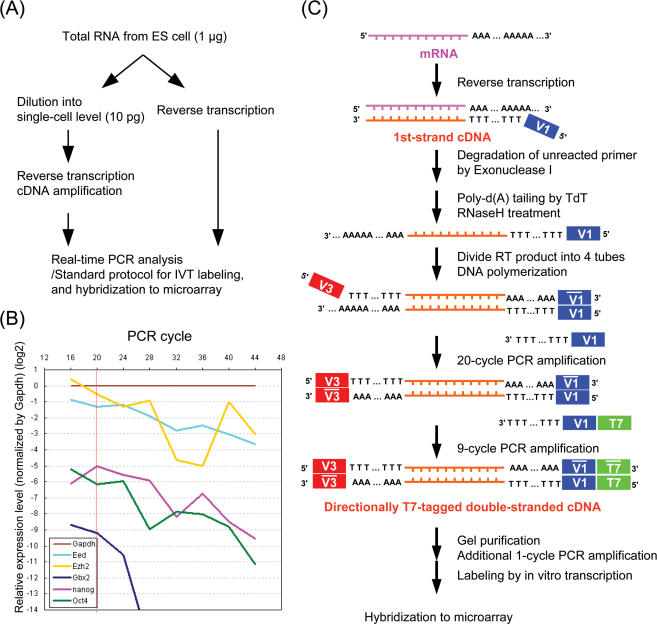
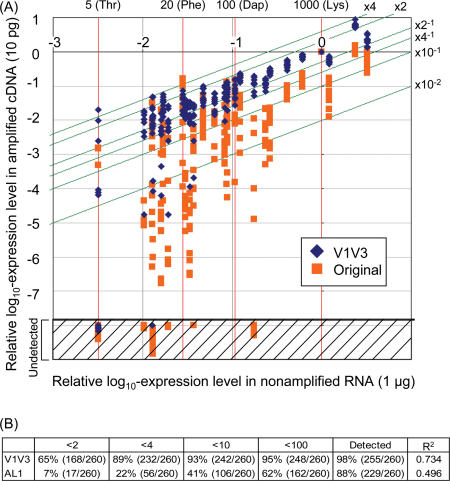
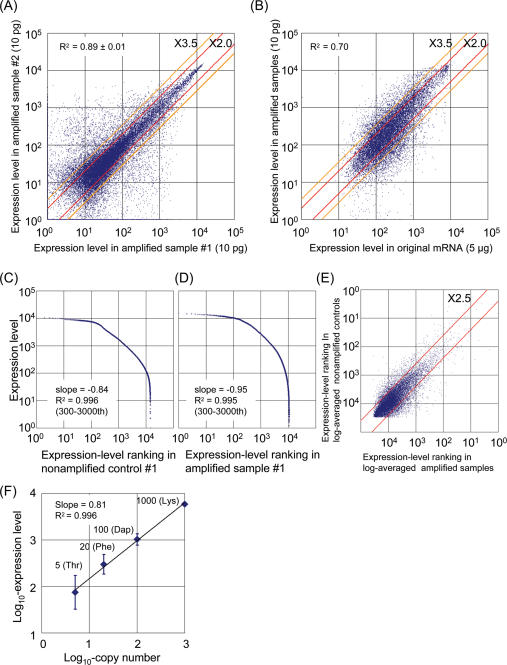
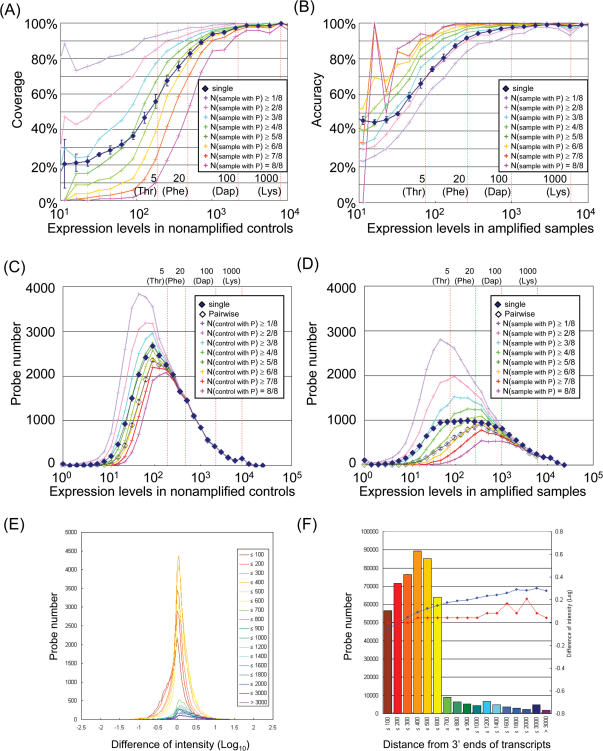
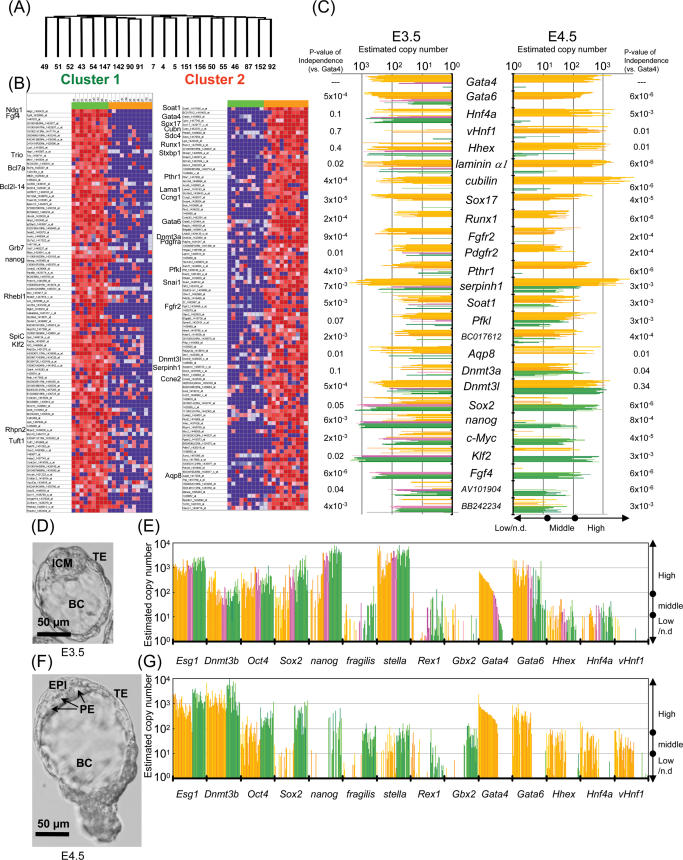
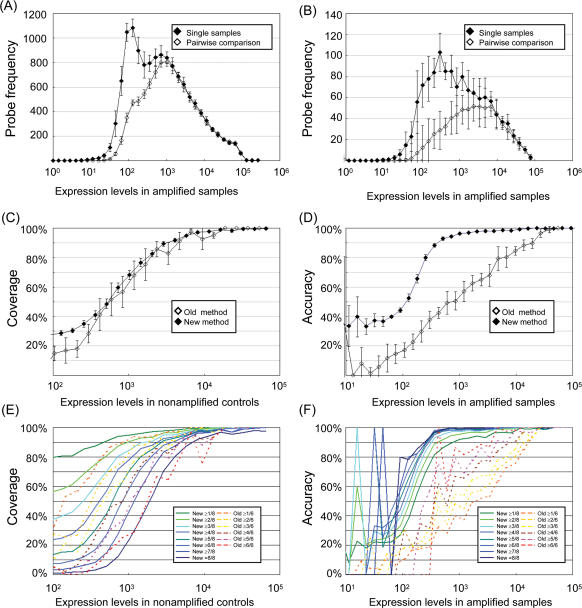
A systems-level understanding of a small but essential population of cells in development or adulthood (e.g. somatic stem cells) requires accurate quantitative monitoring of genome-wide gene expression, ideally from single cells. We report here a strategy to globally amplify mRNAs from single cells for highly quantitative high-density oligonucleotide microarray analysis that combines a small number of directional PCR cycles with subsequent linear amplification. Using this strategy, both the representation of gene expression profiles and reproducibility between individual experiments are unambiguously improved from the original method, along with high coverage and accuracy. The immediate application of this method to single cells in the undifferentiated inner cell masses of mouse blastocysts at embryonic day (E) 3.5 revealed the presence of two populations of cells, one with primitive endoderm (PE) expression and the other with pluripotent epiblast-like gene expression. The genes expressed differentially between these two populations were well preserved in morphologically differentiated PE and epiblast in the embryos one day later (E4.5), demonstrating that the method successfully detects subtle but essential differences in gene expression at the single-cell level among seemingly homogeneous cell populations. This study provides a strategy to analyze biophysical events in medicine as well as in neural, stem cell and developmental biology, where small numbers of distinctive or diseased cells play critical roles.


Figures

Figure 1
Figure 1
Schematic diagram of the key features of the global cDNA amplification method. (A) Evaluation system to verify representation of amplified cDNA from diluted ES cellular RNA by Q-PCR and/or microarray. (B) Gene representation distorted during the global PCR. Diluted ES cellular RNA (10 pg) was amplified as described elsewhere (21), and the replicates of amplification were sequentially sampled at 16, 20, 24, 28, 32, 36, 40 and 44 cycles. The expression levels of Gapdh, Eed, Ezh2, Gbx2, nanog and Oct4 were measured by Q-PCR, normalized by that of Gapdh, and represented with brown, cyan, yellow, blue, pink and green lines, respectively. The averages of four independent experiments are plotted. (C) Schematic diagram of cDNA amplification. The mRNA and cDNA are colored pink and orange, respectively. The V1, V3 and T7 promoter sequences are represented by blue, red and green boxes, respectively. The bars above the letters represent the complementary sequences.
Figure 2
Figure 2
Sequence analysis of amplified cDNAs. (A) Sequence of the amplified cDNAs aligned with the complementary sequences of the corresponding 3′ transcript ends. A, C, G and T are represented by letters in red, blue, orange and green boxes, respectively. The cDNA sequences from the NCBI database (upper) and the PCR products (lower) are aligned in a pairwise manner. The transcript ends in cDNA sequences from the NCBI database are indicated by red stars. (B) Sequence data on the 5′ ends of the amplified transcripts. The nucleic acids are represented in the same manner as in (A). (C) Schematic summary of the PCR products. The average nucleotide lengths measured by the sequencing of the 40 cDNAs are indicated. Blue, red and green bars represent V1 and V3 primer sequences and T7 promoter sequence, respectively. The poly(dA/dT) tracts of variable lengths are represented with black bars. The cDNA body is represented with orange bar.
Figure 3
Figure 3
Performance of the new cDNA amplification method. (A) Representative and reproducible amplification of single-cell cDNAs by the new method (V1V3: blue squares) compared with the original one (orange squares). The previous method was performed exactly as described in a preceding single-cell microarray study (21). Genes known to be expressed in ES cells and the spike RNAs (Lys, Dap, Phe and Thr for 1000, 100, 20 and 5 copies per cell, respectively) are examined: From higher expression levels, Ezh2, Gapdh, Oct4, Lys, Esg1, Sox2, Rex1, nanog, G9a, Dnmt3b, Dap, lefty1, fragilis, Dnmt1, Fgf4, Eras, Yy1, cMyc, nodal, Phe, Foxh1, Tiar, Jak1A, Tnap, stella, Tyk2, Thr. The log expression level of each gene is measured by Q-PCR and normalized with that of the spike RNA Lys (1000 copies per cell). Results of 10 independent amplifications (10 pg) are plotted against the nonamplified control (1 µg). The undetected genes are plotted in the shaded region. Red lines indicate the expression levels of the spike RNA in the nonamplified control. Green lines indicate fold differences from the nonamplified control. (B) Statistical comparison of the present (V1V3) and original (AL1) methods. The frequencies of the probes within the indicated fold differences from the nonamplified control are shown. The frequencies and the R2 values of the total detected probes are also shown. The population parameter is 260, as the number of examined genes except for Lys (used for normalization) is 26 and the sample number is 10.
Figure 4
Figure 4
Performance of the single-cell-level microarray using the new method. (A) Scatter plots of data obtained from two independently amplified samples from 10 pg ES cellular RNA. Expression levels of all probes are plotted. R2 values were calculated for probes detected reproducibly in pair-wise comparisons. (B) Scatter plots of data obtained from nonamplified (5 µg total RNA) and amplified samples. The log-averaged expression levels of probes detected in both are plotted. The 2.0- and 3.5-fold differences are represented by red and yellow lines, respectively, in (A) and (B). (C and D) Relationship between expression levels and their ranking in total RNA from ES cells (C) and an amplified cDNA (D). (E) Scatter plots of expression level ranking between amplified and nonamplified samples. The red lines represent 2.5-fold differences. (F) Expression levels of amplified spike RNAs proportional to their copy numbers (the probe set IDs are AFFX-LysX-3_at, AFFX-DapX-3_at, AFFX-PheX-3_at and AFFX-ThrX-3_at). The log-transformed expression levels were averaged and plotted, with the bars representing SD.
Figure 5
Figure 5
Detection ability of single-cell microarray using the new method. (A) Coverage of the amplified samples, plotted against the expression level in the original RNA. The blue squares represent the means of coverage in single-sample analyses, with bars representing SDs. The results of multiple-sample analyses under the definitions of detection where ≥1–8 of the 8 amplified samples are called Present are represented by the crosses colored with purple, light pink, cyan, green, light green, yellow, red and hot pink, respectively. (B) Accuracy of the amplified samples as a function of expression level. The representation code is the same as in (A). (C) Frequency distribution of probes detected in the nonamplified controls as a function of expression level. (D) Frequency distribution of probes detected in the amplified samples as a function of expression level. The closed blue squares represent the means of the frequency of the Present probes in single nonamplified controls (C) and amplified samples (D), respectively, while the open blue squares represent the means of probes called Present reproducibly in pair-wise comparisons. The color code in the multiple sample analyses is similar to that in (A), corresponding to the definitions of true positive (C) and detection (D), respectively. The expression levels of the spike RNAs in the nonamplified controls (A and C) and amplified samples (B and D) are represented by red dashed lines. (E) Position effects of probe locations on signal intensities. The probes (individual probes, not probe sets) in the Affymetrix GeneChip Mouse Genome 430 2.0 array were classified according to the distance from the probe location to the 3′ ends of the transcripts. The histograms of the probes located within 600 bp from the 3′ ends are represented by warm colors (red/yellow), while those beyond 600 bp are represented by cold colors (blue/green). The probe frequencies were plotted against the difference in intensity between nonamplified controls and amplified samples (log10 transformed). These plots were generated from probes called Present. The probe locations were determined using the EnsEMBL transcript database or, for probes not contained in the EMBL database, using the EST data provided by Affymetrix. (F) Frequency distribution of probes against the distances from the 3′ ends of the transcripts. The total number of probes on the array in each location category is represented by a bar. The color code is the same as in (B). The blue circles and red squares represent the averages and peaks of intensity difference. Note that both are roughly constant relative to the probe location, with shifts of <2-fold (≈100.3).
Figure 6
Figure 6
Direct application of the newly developed method to single ICM cells from mouse E3.5 blastocyst reveals the presence of two distinct cell populations. (A) Hierarchical clustering of single ICM cells. (B) Heat map representation of differentially expressed genes (top 100). The expression levels are color-coded from red (high) to blue (low). The expression levels are normalized in the lows. (C) The correlation of gene expression is preserved between E3.5 and E4.5. The copy numbers of expressed genes were estimated with Q-PCR. Orange, pink and green bars represent high, middle and low/non-detectable expression of Gata4, respectively. P-values of the Chi-square test for independence from Gata4 expression are indicated. (D and F) Blastocysts at E3.5 (D) and E4.5 (F). The typical embryos used for single-cell experiments are shown. (E and G) Expression levels of key genes related to PE and epiblast at E3.5 (E) and E4.5 (G). All of the single-cell samples of ICMs are shown. The representation code is the same as in (C).
Figure 7
Figure 7
Statistical comparison between the new and original (Org.) methods. (A and B) Frequency distribution of Present call in the new (A) and original (B) methods. The data of the original method were obtained from a previous microarray study using GeneChip [Supplementary Data set S6 (21)]. The closed squares represent the average frequencies of the probes (mean ± SD) called Present in single samples. The open squares represent the average frequency (mean ± SD) of the probes called Present reproducibly in pair-wise comparisons. The expression levels are normalized as described in the text. (C) Coverage in single sample analyses. The closed and open squares represent coverage of the new and original methods, respectively, with the bars representing SD. (D) Accuracy in single-sample analyses. The representation manner is the same as in (C). (E) Coverage in multiple sample analyses. Data from the new method are represented by solid lines in cold colors (blue/green). Data from the original method are represented by dashed lines in warm colors (red/yellow). Each line represents the indicated definition of detection. (F) Accuracy in multiple-sample analyses. The representation manner is the same as in (E).

References

    1. Hartwell L.H., Hopfield J.J., Leibler S., Murray A.W. From molecular to modular cell biology. Nature. 1999;402:C47–C52. - PubMed
    1. Kitano H. Systems biology: a brief overview. Science. 2002;295:1662–1664. - PubMed
    1. Westerhoff H.V., Palsson B.O. The evolution of molecular biology into systems biology. Nat. Biotechnol. 2004;22:1249–1252. - PubMed
    1. Lockhart D.J., Dong H., Byrne M.C., Follettie M.T., Gallo M.V., Chee M.S., Mittmann M., Wang C., Kobayashi M., Horton H., et al. Expression monitoring by hybridization to high-density oligonucleotide arrays. Nat. Biotechnol. 1996;14:1675–1680. - PubMed
    1. Baugh L.R., Hill A.A., Brown E.L., Hunter C.P. Quantitative analysis of mRNA amplification by in vitro transcription. Nucleic Acids Res. 2001;29:E29. - PMC - PubMed

Publication types