Comparative Study
. 2006 Mar 17;34(5):1571-80.
doi: 10.1093/nar/gkj515. Print 2006.

Spectral clustering of protein sequences

Affiliations
Comparative Study

Spectral clustering of protein sequences

Alberto Paccanaro et al. Nucleic Acids Res. .

Abstract

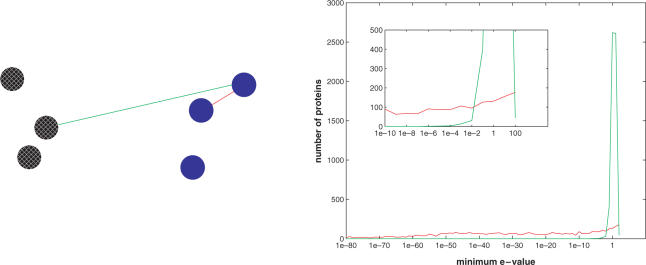
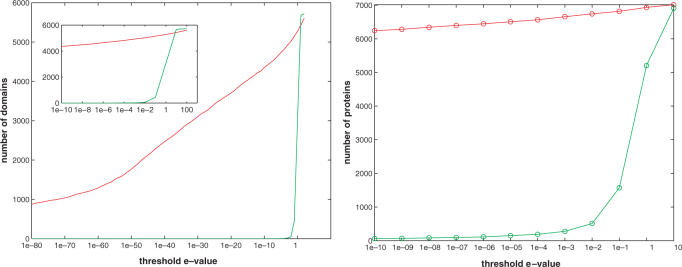
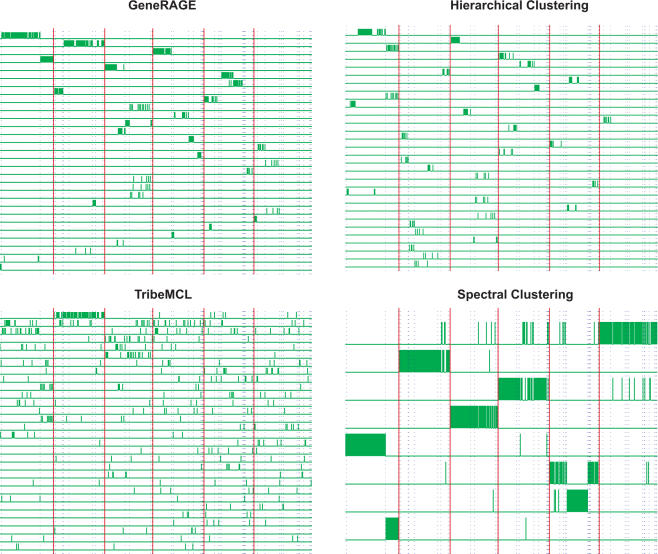
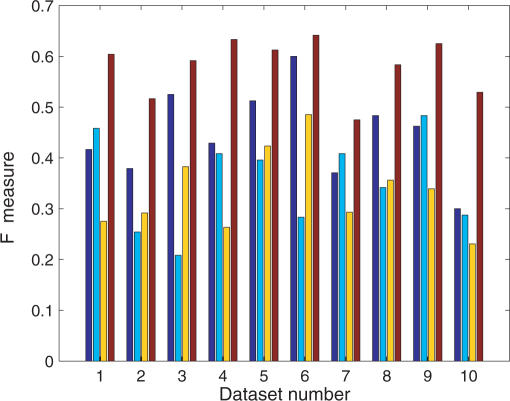
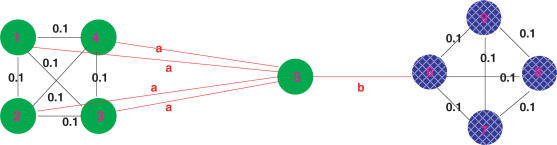
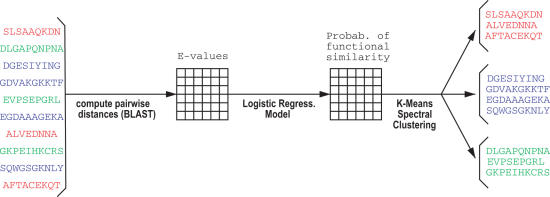
An important problem in genomics is automatically clustering homologous proteins when only sequence information is available. Most methods for clustering proteins are local, and are based on simply thresholding a measure related to sequence distance. We first show how locality limits the performance of such methods by analysing the distribution of distances between protein sequences. We then present a global method based on spectral clustering and provide theoretical justification of why it will have a remarkable improvement over local methods. We extensively tested our method and compared its performance with other local methods on several subsets of the SCOP (Structural Classification of Proteins) database, a gold standard for protein structure classification. We consistently observed that, the number of clusters that we obtain for a given set of proteins is close to the number of superfamilies in that set; there are fewer singletons; and the method correctly groups most remote homologs. In our experiments, the quality of the clusters as quantified by a measure that combines sensitivity and specificity was consistently better [on average, improvements were 84% over hierarchical clustering, 34% over Connected Component Analysis (CCA) (similar to GeneRAGE) and 72% over another global method, TribeMCL].


Figures

Figure 1
Figure 1
(Left) Pictorial description of how the plot to the right was generated. A protein is represented by a circle. Assume that there are two super-families, identified by the two different colours, blue (solid) and black (pattern). For each protein in turn we computed the distance to the closest protein with the same colour (and we used it for the red plot) and the distance to the closest protein with a different colour (and we used it for the green plot). In the figure, the distances used for one of the blue proteins are shown. (Right) Distribution of minimum E-values within (red) and across (green) super-families in Astral-95, for E-values between 1e−80 and 100.
Figure 2
Figure 2
Plots showing the number of non-singleton domains in Astral-95 that hit a member of the same super-family (red line) or different super-family (green line) beneath a threshold E-value. The left plot was generated using BLAST, considering E-values between 1e−80 and 100. The right plot was generated using psi-BLAST (five rounds with Astral-95 embedded in non-redundant protein database), considering E-values between 1e−10 and 10.
Figure 3
Figure 3
Clustering results on the 507 dataset with our implementation of GeneRAGE (Top Left), hierarchical clustering (Top Right), TribeMCL (Bottom Left) and our Spectral Clustering algorithm (Bottom Right). The figures show only the top 30 most populated clusters returned by each algorithm and 8 for the spectral clustering, since it returned only 8 clusters. Each row in the diagrams corresponds to a different cluster. Short (green) bars represent the assignment of each protein sequence to a cluster. Each protein has one of these bars in only one of the rows (clusters); the presence of the bar means that the protein is assigned to that cluster. Boundaries between super-families are shown by vertical thick (red) lines; boundaries between families within each super-family are shown by dotted (blue) lines. The dataset has 6 super-families, orderly from left to right: Globin-like (88), EF-hand (83), Cupredoxins (78), (Trans)glycosidases (83), Thioredoxin-like (81), Membrane all-alpha (94).
Figure 4
Figure 4
F-measure of the cluster quality on the 10 randomly drawn subsets from SCOP. For each dataset the bars represent the performance respectively, from left to right: our implementation of GeneRAGE (dark blue), TribeMCL (light blue) with inflation parameter set to 1.60, hierarchical clustering (yellow) and our spectral method (red).
Figure 5
Figure 5
Pictorial representation of proteins belonging to two different super-families, identified by green (solid) and blue (pattern) circles, respectively. Numbers on the connection represent distances between the proteins.
Figure 6
Figure 6
The scheme of the method that we used in our experiments. Proteins of the same colour are evolutionary related.

References

    1. Ballard D., Brown C. Computer Vision. Englewood Cliffs: Prentice-Hall; 1982.
    1. Enright A.J., Ouzounis C.A. GeneRAGE: a robust algorithm for sequence clustering and domain detection. Bioinformatics. 2000;16:451–457. - PubMed
    1. Krause A., Stoye J., Vingron M. The SYSTERS protein sequence cluster set. Nucleic Acids Res. 2000;28:270–272. - PMC - PubMed
    1. Yona G., Linial N., Linial M. ProtoMap: automatic classification of protein sequences and hierarchy of protein families. Nucleic Acids Res. 2000;28:49–55. - PMC - PubMed
    1. Pipenbacher P., Schliep A., Schneckener S., Schonhuth A., Schomburg D., Schrader R. ProClust: improved clustering of protein sequences with an extended graph-based approach. Bioinformatics. 2002;18:S182–S191. - PubMed

Publication types