. 2006 Apr;12(4):433-40.
doi: 10.1038/nm1390. Epub 2006 Mar 19.

Newly expressed SUR1-regulated NC(Ca-ATP) channel mediates cerebral edema after ischemic stroke

Affiliations

Newly expressed SUR1-regulated NC(Ca-ATP) channel mediates cerebral edema after ischemic stroke

J Marc Simard et al. Nat Med. 2006 Apr.

Abstract

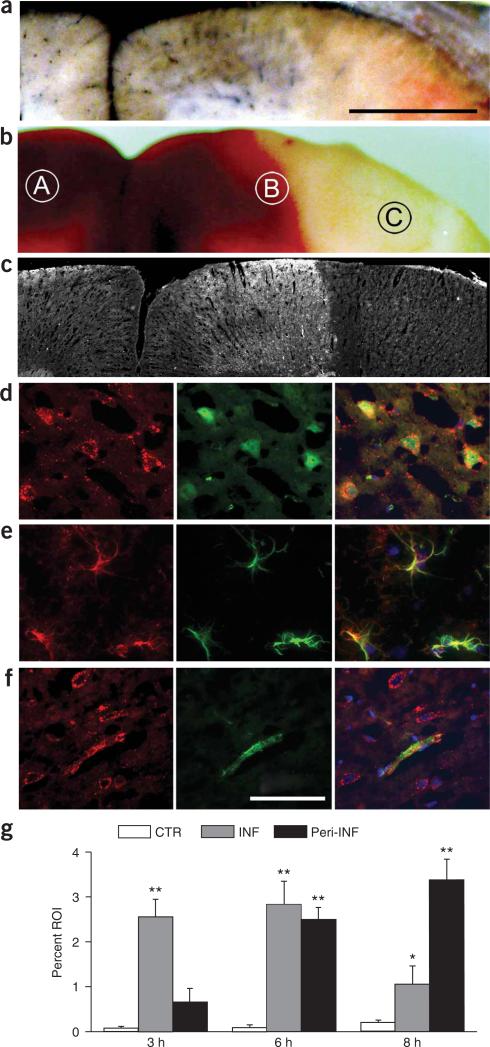
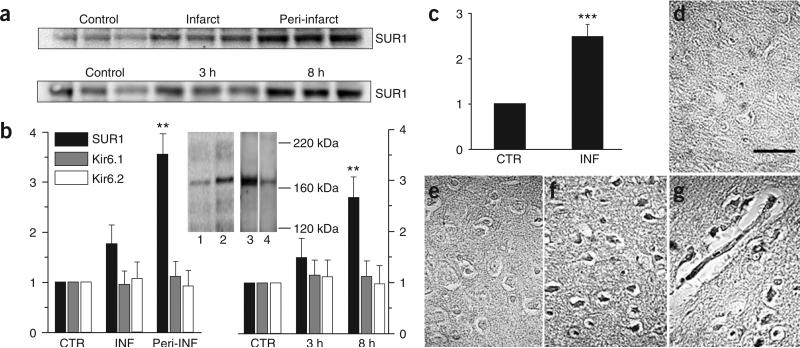
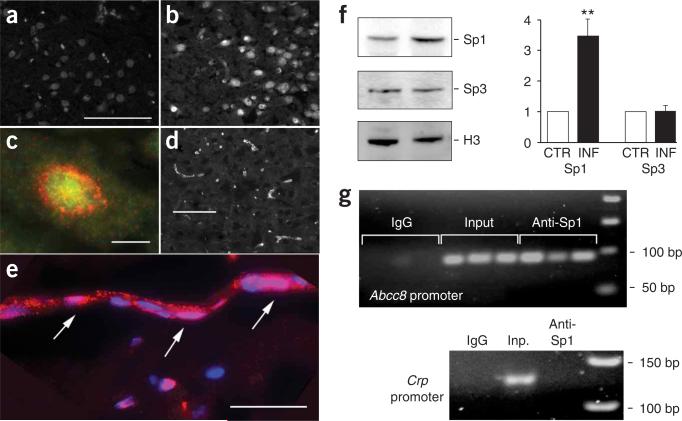
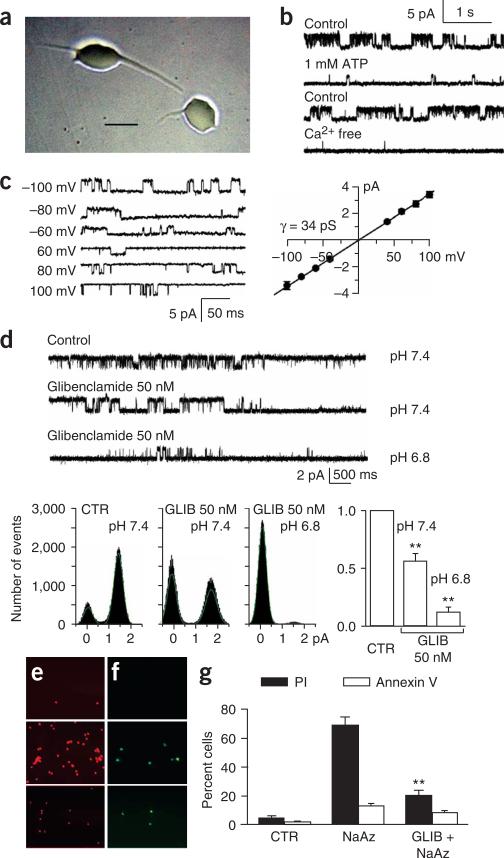
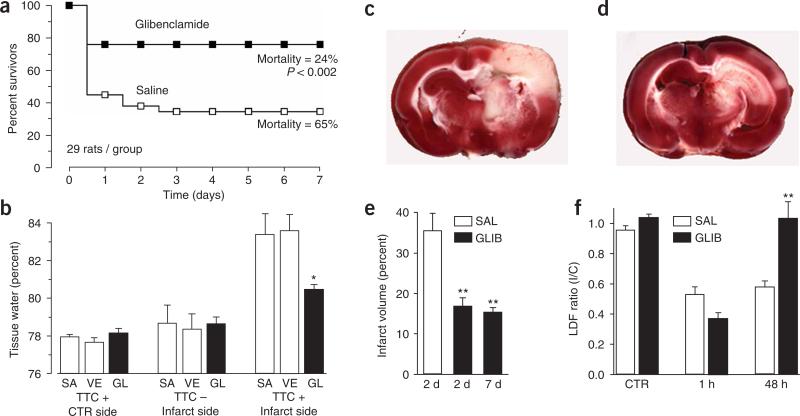
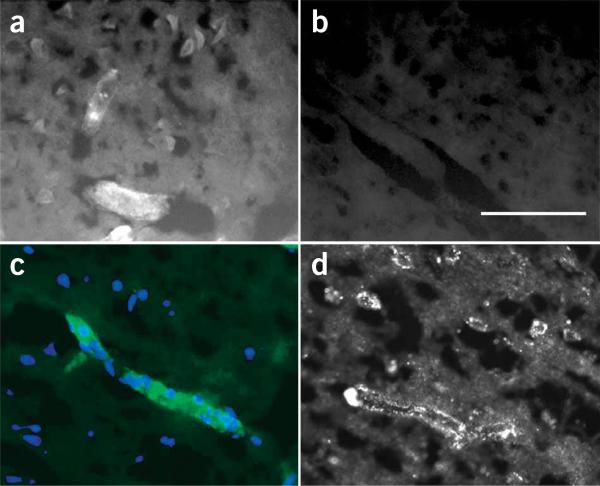
Pathological conditions in the central nervous system, including stroke and trauma, are often exacerbated by cerebral edema. We recently identified a nonselective cation channel, the NC(Ca-ATP) channel, in ischemic astrocytes that is regulated by sulfonylurea receptor 1 (SUR1), is opened by depletion of ATP and, when opened, causes cytotoxic edema. Here, we evaluated involvement of this channel in rodent models of stroke. SUR1 protein and mRNA were newly expressed in ischemic neurons, astrocytes and capillaries. Upregulation of SUR1 was linked to activation of the transcription factor Sp1 and was associated with expression of functional NC(Ca-ATP) but not K(ATP) channels. Block of SUR1 with low-dose glibenclamide reduced cerebral edema, infarct volume and mortality by 50%, with the reduction in infarct volume being associated with cortical sparing. Our findings indicate that the NC(Ca-ATP) channel is crucially involved in development of cerebral edema, and that targeting SUR1 may provide a new therapeutic approach to stroke.


Figures

Figure 1
Figure 1
SUR1 is upregulated in MCA stroke model. (a–c) Watershed area between MCA-anterior cerebral artery in three rats after MCAO, identified by postmortem perfusion of Evans blue dye and India ink (a), by TTC staining (b) and by immunofluorescence imaging for SUR1 at 8 h (c). Scale bar in a, 1 mm. (d–f) Immunofluorescence images showing SUR1 (red) in cells double labeled (green) for the neuronal marker NeuN (d), the astrocytic marker GFAP (e) or the endothelial cell marker von Willebrand factor (f). Scale bar in f, 50 μm. Superimposed images of double-labeled fields are also shown; image obtained either at 3 h from the core of the infarct (d) or at 8 h from the peri-infarct region (e,f). Cy3-conjugated (red) and FITC-conjugated (green) secondary antibodies were used. (g) Analysis of immunohistochemical labeling for SUR1 in tissue sections obtained 3 h, 6 h and 8 h after MCAO; for all sections, labeling was analyzed in three regions, the uninvolved hemisphere, the peri-infarct region and the core of the infarct (labeled A, B and C, respectively, in b). CTR, control; INF, infarct region; Peri-INF, peri-infarct region. Data are expressed as the percent of the region of interest (ROI) showing specific labeling. Values are mean ± s.e.m.; three rats per time point. The following values were significantly different (by ANOVA): at 3 h, infarct versus control (**P < 0.01); at 6 h, infarct and peri-infarct versus control (**P < 0.01); at 8 h, infarct versus control (*P < 0.05) and peri-infarct versus control (**P < 0.01).
Figure 2
Figure 2
SUR1 but not Kir6.1 or Kir6.2 is transcriptionally upregulated in MCA stroke model. (a) Immunoblots for SUR1 (180 kDa) at different locations (upper) and times (lower) after MCAO. Lysates were obtained at 8 h after MCAO from regions indicated (upper) or from TTC+ peri-infarct regions at times indicated (lower). Each lane is from one rat. (b) Quantification of the data from a combined with comparable immunoblot data for Kir6.1 and Kir6.2. For each blot, data were normalized to values of β-actin and to the control data for that blot. **P < 0.01. Peri-INF, peri-infarct region. Specificity of SUR1-specific antibody was confirmed by: (i) showing labeling of one band (180 kDa) in the range between 116−290 kDa in control and peri-infarct tissues at 8 h (insert, lanes 1 and 2, respectively); (ii) labeling of one band at the same mass was markedly reduced by in vivo knockdown of SUR1 expression in ischemic gliotic tissue using in situ infusion of antisense, but not random sequence, oligodeoxynucleotide (insert, lane 3 versus 4). (c) Quantification of real-time PCR for SUR1 in the core of the infarct (INF) and contralateral unaffected region (CTR) for three rats 3 h after MCAO. Data were normalized to values for Histone 1. ***P < 0.001. (d–g) In situ hybridization for SUR1, 3 h after MCAO. Paraffin sections showed that large neuron-like cells (f) and capillaries (g) in the core of the infarct were labeled with antisense probe, whereas tissues from the same areas on the control side were not (d). Scale bar in d, 50 μm. Core tissue labeled with ‘sense’ probe as a control is also shown (e). Pericellular edema is shown in e–g.
Figure 3
Figure 3
Association of Sp1 and SUR1 promoter region in cerebral ischemia. (a–e) Immunofluorescence imaging for Sp1 in contralateral control region (a), in the core of the infarct 3 h after MCAO (b,c) and in the peri-infarct region 6 h after MCAO (d,e). In c, the section was double labeled for Sp1 (green) and SUR1 (red). In e, the section was also stained with the nuclear marker DAPI, with pink indicating nuclear localization of Sp1 (arrows). (f) Immunoblots of nuclear lysates and densitometric analyses of blots for Sp1 and Sp3, with Histone 3 (H3) as control, for contralateral control (CTR) and core (INF) tissues 3 h after MCAO. **P < 0.01. (g) Electrophoretic gels of PCR products for the proximal promoter regions of Abcc8 and the negative control, Crp. Chromatin isolated from the core of the infarct 2 h after MCAO in three different animals. DNA templates were: (i) 20 μg chromatin ‘immunopreciptated’ using nonspecific mouse IgG as negative control (IgG); (ii) 2 μg total chromatin as positive control (Input or Inp.); or (iii) 20 μg chromatin immunopreciptated using Sp1-specific antibody (Anti-Sp1). Scale bars in a and d, 100 μm; in c, 10 μm; in e, 25 μm.
Figure 4
Figure 4
Expression of functional NCCa-ATP channels in cerebral ischemia. (a) Phase-contrast micrograph of neuron-like cells isolated from the core 3 h after MCAO. Scale bar, 20 μm. (b) Single-channel records of an inside-out patch from a neuron isolated from the core 3 h after MCAO, showing channel activity recorded under control conditions (Cs+ as the charge carrier; 0 ATP, 1 μM Ca2+, pH 7.4) before (first trace) and after addition of ATP (1 mM; second trace); records from another patch recorded under control conditions before (third trace) and after washout of Ca2+ (fourth trace); all records obtained at +100 mV. (c) Single-channel records of an inside-out patch from a neuron isolated from the core 3 h after MCAO, showing channel activity recorded at the potentials indicated, using K+ as the charge carrier, with 0 ATP and 1 μM Ca2+ in the bath solution; open-channel slope conductance, 34 pS. Values are mean ± s.e.m. from three cells. (d) Single-channel records of an inside-out patch from a neuron isolated from the core 3 h after MCAO, showing channel activity recorded under control conditions (CTR; as above) before (first trace) and after addition of 50 nM glibenclamide (GLIB) at pH 7.4 (second trace), and after change to 50 nM glibenclamide at pH 6.8 (third trace). Open-time histograms for the same patch are shown. Bar graph shows mean change in open probability in three patches with 50 nM glibenclamide at pH 7.4 and pH 6.8. **P < 0.01. (e,f) Fluorescence images showing propidium iodide (PI; red) and annexin V (green) labeling of astrocytes from ischemic gliotic tissue, 10 min after exposure to vehicle (upper panels), 10 min after exposure to 1 mM sodium azide (middle panels), and 10 min after exposure to 1 mM sodium azide after a 5-min pretreatment with 1 μM glibenclamide (lower panels). (g) Percent of cells labeled with PI (filled bars) and annexin V (open bars) for the same conditions as in e,f. NaAz, sodium azide. **P < 0.01.
Figure 5
Figure 5
Glibenclamide reduces mortality, edema and infarct volume, and improves cerebral blood flow in MCA stroke models. (a) Mortality was assessed during 7 d after MCAO (MCE model) in two treatment groups, each consisting of 19 female and 10 male rats, treated with either saline (open symbols) or glibenclamide (filled symbols). Mortality at 7 d was significantly different (by χ2, P < 0.002); subgroup analyses for gender showed similar results. (b) Edema was assessed 8 h after MCAO (MCE model) in three treatment groups, each consisting of six male rats treated with either saline alone (SA), vehicle (VE; saline plus DMSO) or glibenclamide in vehicle (GL). Tissues were separated into TTC+ and TTC portions before determining wet/dry weights. *P < 0.05. (c–e) Infarct volume was assessed at 2 d or 7 d after MCAO (thromboembolic model) in three groups, consisting of 9, 9 and 7 male rats respectively, treated with either saline (SAL; 2 d) or glibenclamide (GLIB; 2 and 7 d). **P < 0.01. Images of TTC-stained coronal sections 2 d after MCAO (thromboembolic model) in a rat treated with saline (c) and another treated with glibenclamide (d), showing cortical sparing with glibenclamide. (f) Relative cerebral blood flow, measured by laser Doppler flowmetry (LDF), before (CTR), 1 h after and 48 h after MCAO, in two groups, each consisting of four male rats, treated with either saline (open bars) or glibenclamide (filled bars). **P < 0.01. I/C, ipsilateral/contralateral.
Figure 6
Figure 6
Tissue distribution of BODIPY-glibenclamide in MCA stroke model. (a–c) Fluorescence images of brain sections in a rat 8 h after MCAO (MCE model) and administration of BODIPY-glibenclamide. Fluorescent labeling was evident in cells, microvessels (a) and capillaries (c) from ischemic regions, but not in the contralateral hemisphere (b). Scale bar in b, 100 μm. Images in a,b are from the same rat, taken with the same exposure time. In c, the single layer of nuclei labeled with DAPI (blue) confirms that the structure brightly labeled by BODIPY-glibenclamide (green) is a capillary. (d) Immunofluorescence image of a brain section from a rat 8 h after MCAO (MCE model) labeled with SUR1-specific antibody showing strong labeling in a capillary and in adjacent neuron-like cells.

References

    1. Ayata C, Ropper AH. Ischaemic brain oedema. J. Clin. Neurosci. 2002;9:113–124. - PubMed
    1. Seino S. ATP-sensitive potassium channels: a model of heteromultimeric potassium channel/receptor assemblies. Annu. Rev. Physiol. 1999;61:337–362. - PubMed
    1. Chen M, Dong Y, Simard JM. Functional coupling between sulfonylurea receptor type 1 and a nonselective cation channel in reactive astrocytes from adult rat brain. J. Neurosci. 2003;23:8568–8577. - PMC - PubMed
    1. Chen M, Simard JM. Cell swelling and a nonselective cation channel regulated by internal Ca2+ and ATP in native reactive astrocytes from adult rat brain. J. Neurosci. 2001;21:6512–6521. - PMC - PubMed
    1. Mathews KS, et al. Rapid quantification of ischaemic injury and cerebroprotection in brain slices using densitometric assessment of 2,3,5-triphenyltetrazolium chloride staining. J. Neurosci. Methods. 2000;102:43–51. - PubMed

Publication types

MeSH terms