. 2006 Mar 21:7:59.
doi: 10.1186/1471-2164-7-59.

Large scale real-time PCR validation on gene expression measurements from two commercial long-oligonucleotide microarrays

Affiliations

Large scale real-time PCR validation on gene expression measurements from two commercial long-oligonucleotide microarrays

Yulei Wang et al. BMC Genomics. .

Abstract

Background: DNA microarrays are rapidly becoming a fundamental tool in discovery-based genomic and biomedical research. However, the reliability of the microarray results is being challenged due to the existence of different technologies and non-standard methods of data analysis and interpretation. In the absence of a "gold standard"/"reference method" for the gene expression measurements, studies evaluating and comparing the performance of various microarray platforms have often yielded subjective and conflicting conclusions. To address this issue we have conducted a large scale TaqMan Gene Expression Assay based real-time PCR experiment and used this data set as the reference to evaluate the performance of two representative commercial microarray platforms.

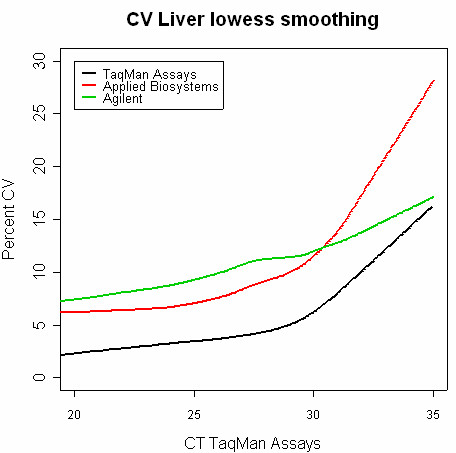
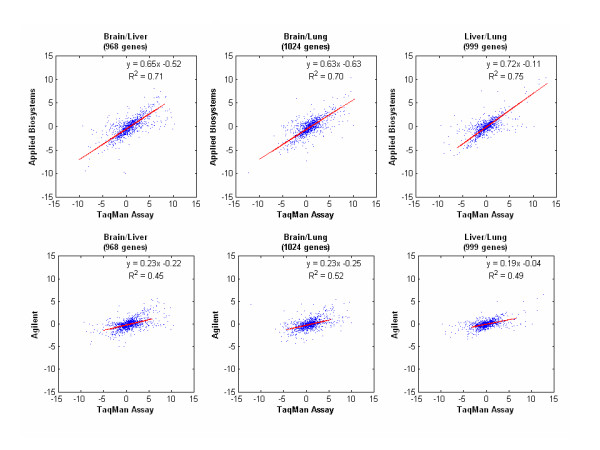
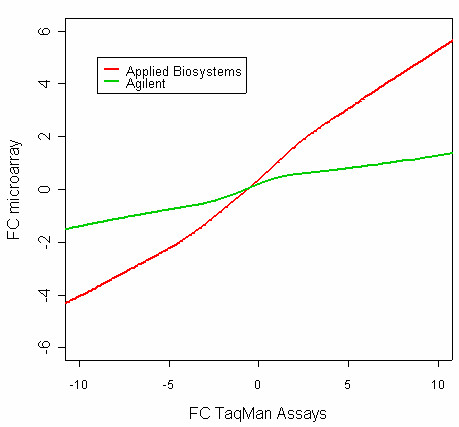
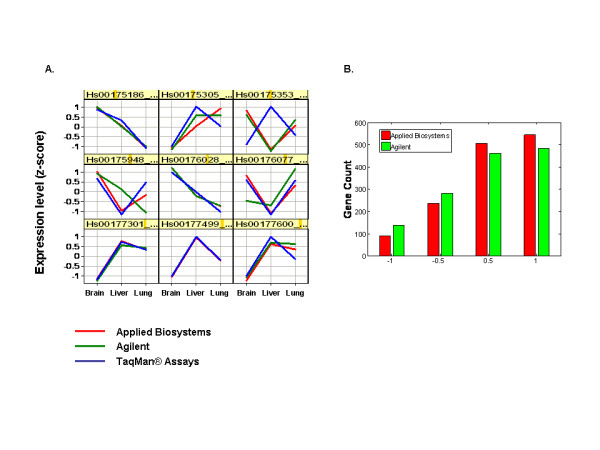
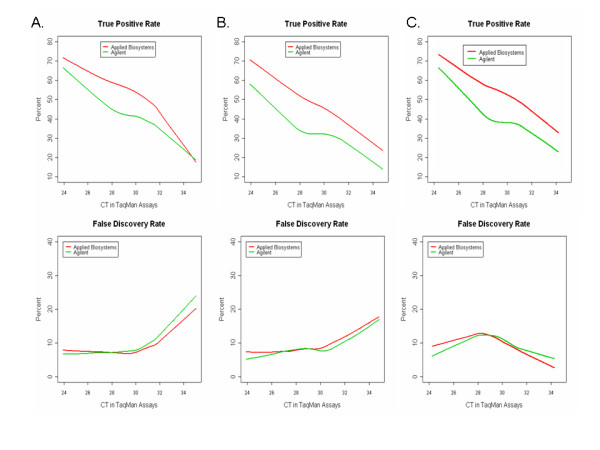
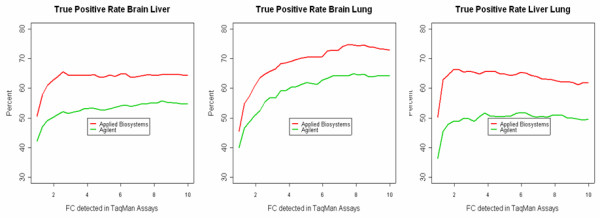
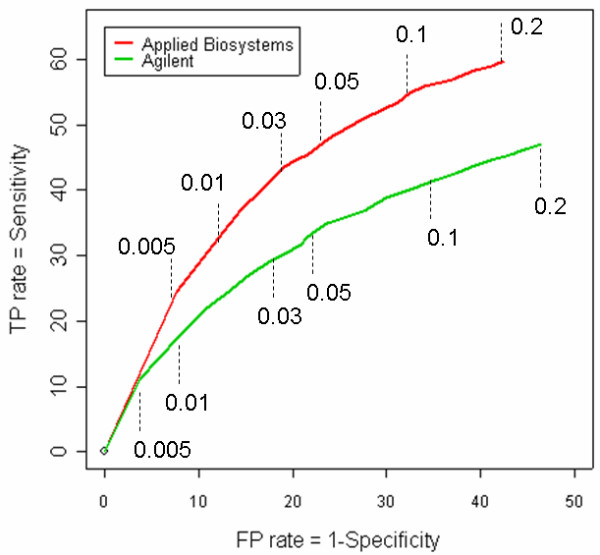
Results: In this study, we analyzed the gene expression profiles of three human tissues: brain, lung, liver and one universal human reference sample (UHR) using two representative commercial long-oligonucleotide microarray platforms: (1) Applied Biosystems Human Genome Survey Microarrays (based on single-color detection); (2) Agilent Whole Human Genome Oligo Microarrays (based on two-color detection). 1,375 genes represented by both microarray platforms and spanning a wide dynamic range in gene expression levels, were selected for TaqMan Gene Expression Assay based real-time PCR validation. For each platform, four technical replicates were performed on the same total RNA samples according to each manufacturer's standard protocols. For Agilent arrays, comparative hybridization was performed using incorporation of Cy5 for brain/lung/liver RNA and Cy3 for UHR RNA (common reference). Using the TaqMan Gene Expression Assay based real-time PCR data set as the reference set, the performance of the two microarray platforms was evaluated focusing on the following criteria: (1) Sensitivity and accuracy in detection of expression; (2) Fold change correlation with real-time PCR data in pair-wise tissues as well as in gene expression profiles determined across all tissues; (3) Sensitivity and accuracy in detection of differential expression.

Conclusion: Our study provides one of the largest "reference" data set of gene expression measurements using TaqMan Gene Expression Assay based real-time PCR technology. This data set allowed us to use an alternative gene expression technology to evaluate the performance of different microarray platforms. We conclude that microarrays are indeed invaluable discovery tools with acceptable reliability for genome-wide gene expression screening, though validation of putative changes in gene expression remains advisable. Our study also characterizes the limitations of microarrays; understanding these limitations will enable researchers to more effectively evaluate microarray results in a more cautious and appropriate manner.


Figures

Figure 1
Figure 1
Intra-platform reproducibility of the two microarray platforms. Data on liver sample are shown as a representative example. All 21,171 common genes are represented in these plots. Blue points: concordantly detectable on both replicates; Red points: not detectable in either replicate. (A). M-A plots of two technical replicates analyzed by the two microarray platforms. x-axis: A = 0.5*log2 (Signal_rep1*Signal_rep2); y-axis: M = log2 (Signal_rep1/Signal_rep2). (B). Coefficients of variation (CV) for each microarray platform as a function of gene expression level across four technical replicates. For Agilent arrays, only signals of Cy5 channel were used for illustration in these plots. The black line represents a loess smoothing fitting curve to the 84,684 data points in each platform. (C). Scatter plots of the expression levels measured by each microarray platform for the two technical replicates: For Applied Biosystems arrays, expression levels are represented by signal intensity directly; for Agilent arrays, the expression levels are represented by relative ratio vs. common reference sample (UHR). The black dashed lines indicate the ± 2-fold changes.
Figure 2
Figure 2
Coefficients of variation (CV) for the two microarray platforms and TaqMan® Gene Expression Assay based real-time PCR. The CV of 1,375 genes analyzed by all three platforms is plotted as a function of gene expression level. The lines represent lowess smoothing fitting curves to the 5,500 data points in each platform.
Figure 3
Figure 3
Correlation of fold change in pair-wise tissues determined by microarray platforms and TaqMan® Gene Expression Assay based real-time PCR. y-axis, fold change determined by microarrays which is defined as: For Applied Biosystems Arrays, log2 (MedianSignal_tissue1/MedianSignal_tissue2); for Agilent arrays, log2(MedianSignal_tissue1/MedianSignal_UHR)- log2(medianSignal_tissue2/MedianSignal_UHR); x-axis, fold change determined by real-time PCR, which is defined as ΔΔCt = (Ct_tissue2-Ct_PPIA)-(Ct_tissue1-Ct_PPIA). For each pair-wise comparison, genes were filtered based on real-time PCR detection thresholds (detectable in at least 3 out of 4 technical replicates in each tissue and detectable in both tissues, the number of genes are shown in the parentheses). A robust linear regression fitting and the corresponding R2 value are presented in each plot.
Figure 4
Figure 4
Fold change repression in microarray platforms. Fold change of pair-wise tissues (brain vs. liver, brain vs. lung and liver vs. lung) determined by each microarray platform (y-axis) were plotted aganinst those determined by TaqMan Assays (x-axis). Genes were filtered based on real-time PCR detection thresholds (detectable in at least 3 out of 4 technical replicates in at least one of the three tissues). The lines represent lowess smoothing fitting curves to 3,105 data points (sum of all three pair-wise tissues) in each platform.
Figure 5
Figure 5
Spearman rank-order correlation of gene expression profiles across all three tissues determined by microarray platforms and TaqMan® Gene Expression Assay based real-time PCR. (A). Example gene expression profiles on 9 genes determined by Applied Biosystems microarrays, Agilent microarrays, and TaqMan Gene Expression Assay based real-time PCR. The gene expression profile for each gene across the three tissues was determined using the median expression level of the four technical replicates followed by a z-score transformation across the three tissues for each of platforms as described in Methods. (B). Distribution of the Spearman rank-order correlation coefficients (r) of profiles determined by each microarray platform vs. real-time PCR.
Figure 6
Figure 6
Sensitivity and specificity in detection of differential expression at different expression levels. For each platform, significantly differentially expressed genes for any given pair-wise tissues are determined as p-value < 0.05 using a student t-test (Panel A), using p-value adjusted according to Benjamini Horschberg multiple testing to control FDR at 5% (Panel B), or using a fold change cutoff (> 1.2-fold) for the TaqMan reference data sets while using a fold change cutoff (> 1.2-fold) and p-value < 0.05 based on t-test for microarray platforms (Panel C). Composite results for all three pairs of tissues (Brain vs. Liver, Brain vs. Lung, and Liver vs. Lung) were plotted. Gene expression levels are ordered according to TaqMan® Gene Expression Assay measurements (average Ct between the three tissues, only genes detected in both tissues by TaqMan assays were analyzed). A sliding window containing 100 consecutive genes was constructed and moved one gene at a time to cover the whole range of Ct values. Within each sliding window, the True Positive Rate (upper panel) and False Discovery Rate (lower panel) of each microarray platform was computed and plotted as a function of gene expression level.
Figure 7
Figure 7
Sensitivity in detection of differential expression for different fold changes. For each platform, significantly differentially expressed genes for any given pair-wise tissues are determined using t-test at 95% significance level (p-value = 0.05). Using one-sample z-test, genes showing "at least F fold change" with 95% confidence are grouped based on TaqMan® Gene Expression Assays data set. True Positive Rates of each microarray platform was plotted as a function of Fold Change cut-off (range from 1.2 – 10) for each pair-wise tissues.
Figure 8
Figure 8
ROC curve for accuracy in detection of differential expression at different FDR thresholds. Significantly differentially expressed genes are defined as p < 0.05 in student t-test using TaqMan Gene Expression data set as a reference. For each microarray platform, on top of the p-value criteria (p < 0.05 in student t-test), a series of FDR (0–20%) were also applied to achieve increasing stringency. Each point on the ROC curve of a given microarray platform represents the sensitivity (true positive rate) and 1- specificity (false positive rate) at a given FDR level (labeled on dashed lines).

References

    1. Hackett JL, Lesko LJ. Microarray data--the US FDA, industry and academia. Nat Biotechnol. 2003;21:742–743. doi: 10.1038/nbt0703-742. - DOI - PubMed
    1. Petricoin EF, Hackett JL, Lesko LJ, Puri RK, Gutman SI, Chumakov K, Woodcock J, Feigal DWJ, Zoon KC, Sistare FD. Medical applications of microarray technologies: a regulatory science perspective. Nat Genet. 2002;32 Suppl:474–479. doi: 10.1038/ng1029. - DOI - PubMed
    1. Ramaswamy S. Translating cancer genomics into clinical oncology. N Engl J Med. 2004;350:1814–1816. doi: 10.1056/NEJMp048059. - DOI - PubMed
    1. Shi L, Tong W, Goodsaid F, Frueh FW, Fang H, Han T, Fuscoe JC, Casciano DA. QA/QC: challenges and pitfalls facing the microarray community and regulatory agencies. Expert Rev Mol Diagn. 2004;4:761–777. doi: 10.1586/14737159.4.6.761. - DOI - PubMed
    1. Irizarry RA, Warren D, Spencer F, Kim IF, Biswal S, Frank BC, Gabrielson E, Garcia JG, Geoghegan J, Germino G, Griffin C, Hilmer SC, Hoffman E, Jedlicka AE, Kawasaki E, Martinez-Murillo F, Morsberger L, Lee H, Petersen D, Quackenbush J, Scott A, Wilson M, Yang Y, Ye SQ, Yu W. Multiple-laboratory comparison of microarray platforms. Nat Methods. 2005;2:345–350. doi: 10.1038/nmeth756. - DOI - PubMed

LinkOut - more resources