

Collection, focusing, and metering of DNA in microchannels using addressable electrode arrays for portable low-power bioanalysis
- PMID: 16551750
- PMCID: PMC1458754
- DOI: 10.1073/pnas.0506848103
Collection, focusing, and metering of DNA in microchannels using addressable electrode arrays for portable low-power bioanalysis
Abstract
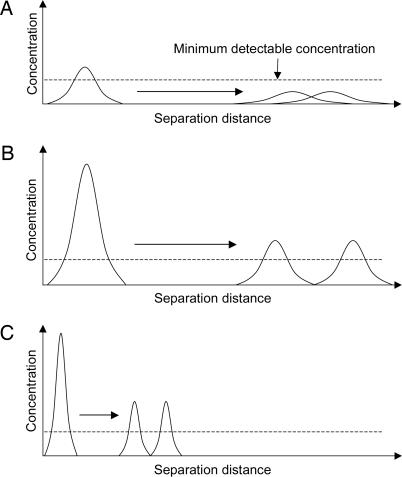
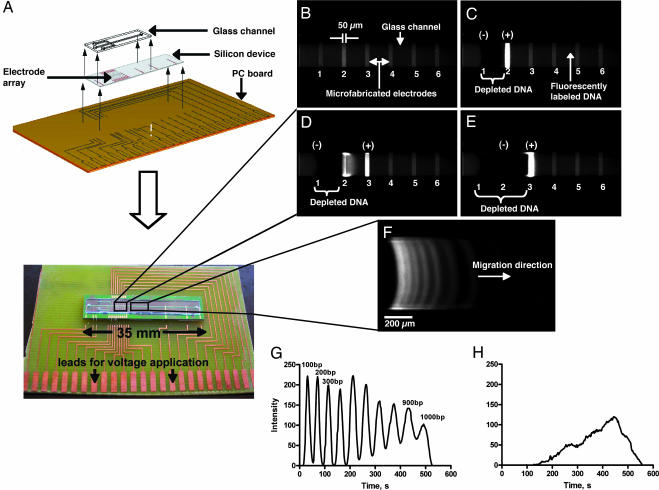
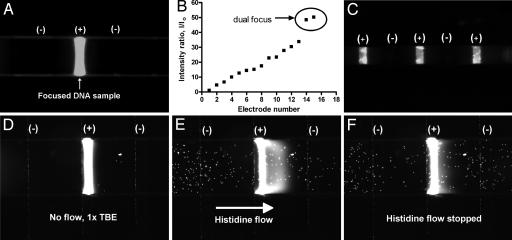
Although advances in microfluidic technology have enabled increasingly sophisticated biosensing and bioassay operations to be performed at the microscale, many of these applications employ such small amounts of charged biomolecules (DNA, proteins, and peptides) that they must first be preconcentrated to a detectable level. Efficient strategies for precisely handling minute quantities of biomolecules in microchannel geometries are critically needed; however, it has proven challenging to achieve simultaneous concentration, focusing, and metering capabilities with current-generation sample-injection technology. By using microfluidic chips incorporating arrays of individually addressable microfabricated electrodes, we demonstrate that DNA can be sequentially concentrated, focused into a narrow zone, metered, and injected into an analysis channel. This technique transports charged biomolecules between active electrodes upon application of a small potential difference (1 V) and is capable of achieving orders of magnitude concentration increases within a small device footprint. The collected samples are highly focused, with sample zone size and shape defined solely by electrode geometry.
Conflict of interest statement
Conflict of interest statement: No conflicts declared.
Figures
Similar articles
-
DNA focusing using microfabricated electrode arrays.Methods Mol Biol. 2009;544:69-79. doi: 10.1007/978-1-59745-483-4_6. Methods Mol Biol. 2009. PMID: 19488694
-
Biochips beyond DNA: technologies and applications.Biotechnol Annu Rev. 2003;9:1-149. doi: 10.1016/s1387-2656(03)09001-x. Biotechnol Annu Rev. 2003. PMID: 14650926 Review.
-
Biosensors in microfluidic chips.Top Curr Chem. 2011;304:117-52. doi: 10.1007/128_2011_143. Top Curr Chem. 2011. PMID: 21516388 Review.
-
Re-use of commercial microfluidics chips for DNA, RNA, and protein electrophoresis.Biotechniques. 2014 Nov 1;57(5):267-71. doi: 10.2144/000114232. eCollection 2014 Nov. Biotechniques. 2014. PMID: 25391916
-
Modulated light-activated electrochemistry at silicon functionalized with metal-organic frameworks towards addressable DNA chips.Biosens Bioelectron. 2019 Dec 15;146:111750. doi: 10.1016/j.bios.2019.111750. Epub 2019 Oct 3. Biosens Bioelectron. 2019. PMID: 31605989
Cited by
-
Development of a sensitive loop-mediated isothermal amplification assay that provides specimen-to-result diagnosis of respiratory syncytial virus infection in 30 minutes.J Clin Microbiol. 2013 Aug;51(8):2696-701. doi: 10.1128/JCM.00662-13. Epub 2013 Jun 12. J Clin Microbiol. 2013. PMID: 23761156 Free PMC article.
-
Tunable in-situ electro-polymerization of hydrogel films for microchip-based bioanalysis.Biomicrofluidics. 2016 May 26;10(3):033103. doi: 10.1063/1.4952420. eCollection 2016 May. Biomicrofluidics. 2016. PMID: 27279930 Free PMC article.
-
Synchronized chaotic targeting and acceleration of surface chemistry in prebiotic hydrothermal microenvironments.Proc Natl Acad Sci U S A. 2017 Feb 7;114(6):1275-1280. doi: 10.1073/pnas.1612924114. Epub 2017 Jan 24. Proc Natl Acad Sci U S A. 2017. PMID: 28119504 Free PMC article.
-
Long-range and superfast trapping of DNA molecules in an ac electrokinetic funnel.Biomicrofluidics. 2008 Dec 5;2(4):44103. doi: 10.1063/1.3037326. Biomicrofluidics. 2008. PMID: 19693367 Free PMC article.
References
-
- Luckey J. A., Norris T. B., Smith L. M. J. Phys. Chem. 1993;97:3067–3075.
-
- Manz A., Harrison D. J., Verpoorte E. M. J., Fettinger J. C., Paulus A., Ludi H., Widmer H. M. J. Chromatogr. 1992;593:253–258.
-
- Harrison D. J., Fluri K., Seiler K., Fan Z. H., Effenhauser C. S., Manz A. Science. 1993;261:895–897. - PubMed
-
- Harrison D. J., Manz A., Fan Z. H., Ludi H., Widmer H. M. Anal. Chem. 1992;64:1926–1932.
-
- Effenhauser C. S., Manz A., Widmer H. M. Anal. Chem. 1993;65:2637–2642.
Publication types
MeSH terms
Substances
Grants and funding
LinkOut - more resources
Full Text Sources
Other Literature Sources
