. 2006 Jul 15;108(2):669-77.
doi: 10.1182/blood-2005-08-3498. Epub 2006 Mar 21.

A murine Mll-AF4 knock-in model results in lymphoid and myeloid deregulation and hematologic malignancy

Affiliations

A murine Mll-AF4 knock-in model results in lymphoid and myeloid deregulation and hematologic malignancy

Weili Chen et al. Blood. .

Abstract

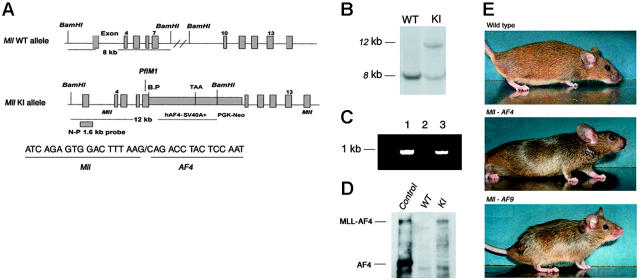
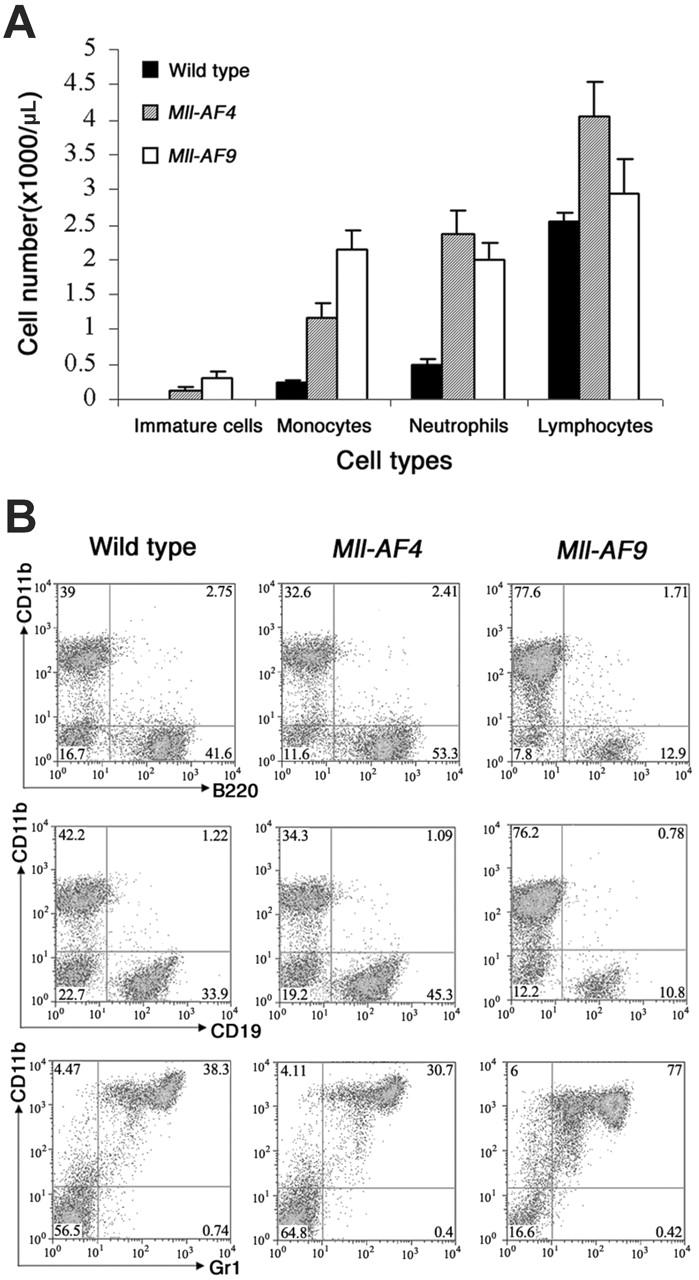
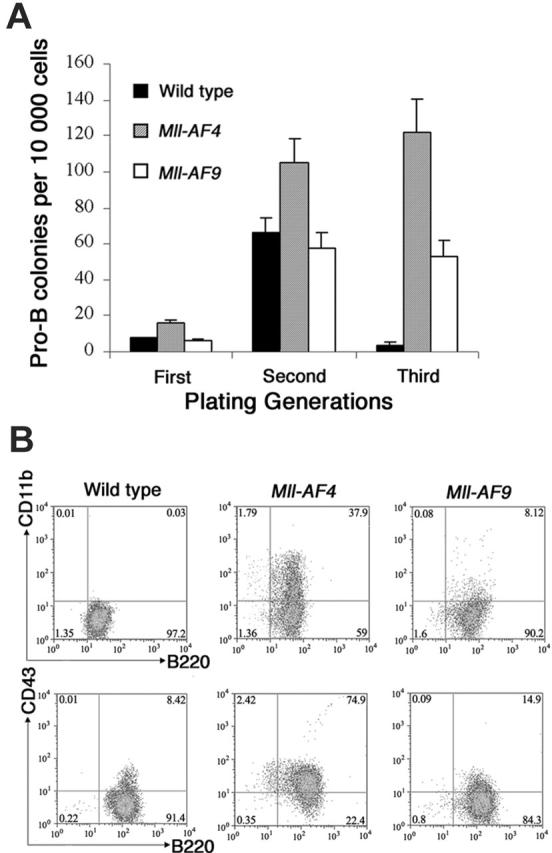
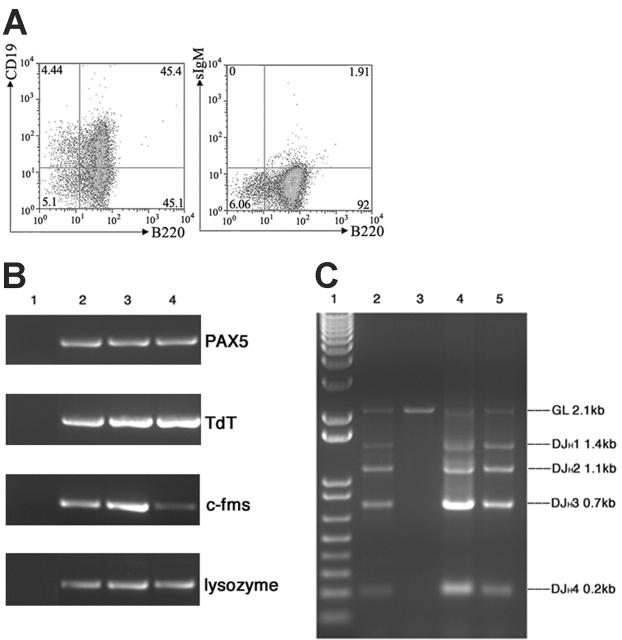
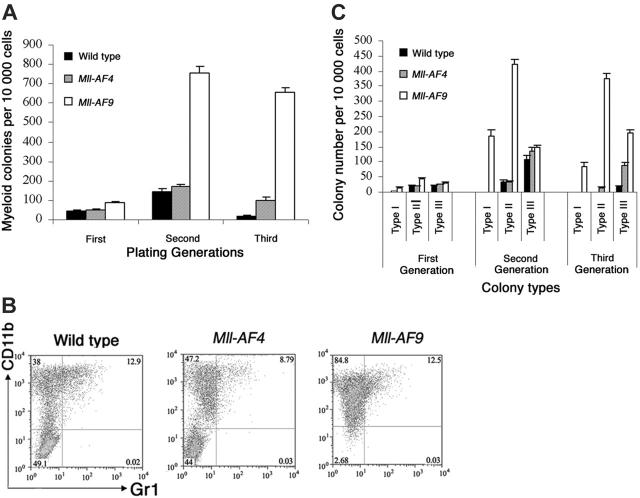
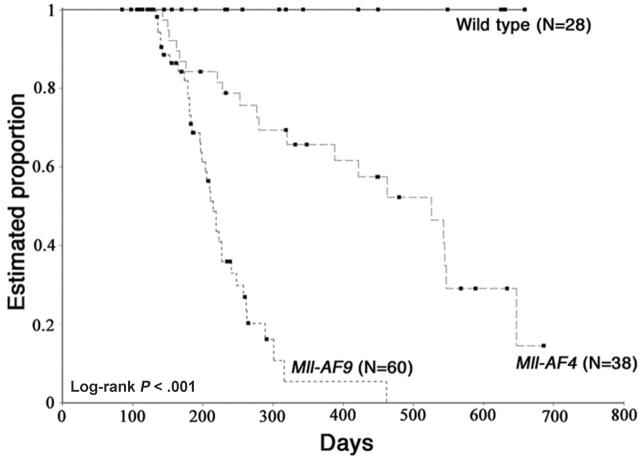
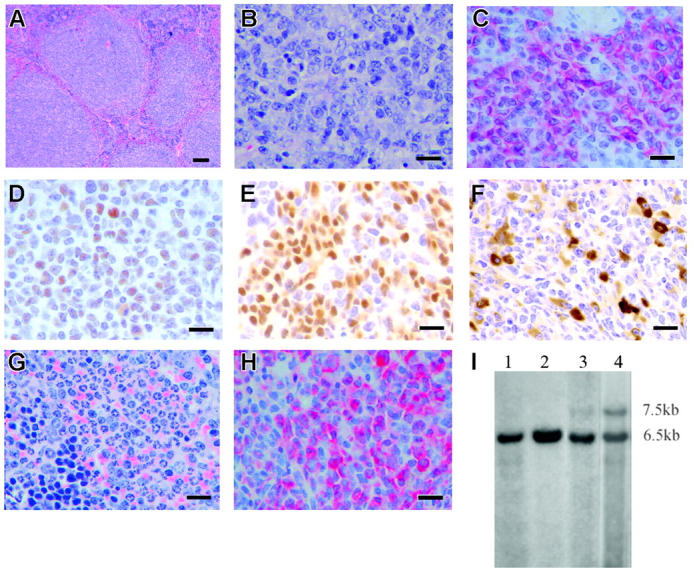
The 2 most frequent human MLL hematopoietic malignancies involve either AF4 or AF9 as fusion partners; each has distinct biology but the role of the fusion partner is not clear. We produced Mll-AF4 knock-in (KI) mice by homologous recombination in embryonic stem cells and compared them with Mll-AF9 KI mice. Young Mll-AF4 mice had lymphoid and myeloid deregulation manifest by increased lymphoid and myeloid cells in hematopoietic organs. In vitro, bone marrow cells from young mice formed unique mixed pro-B lymphoid (B220(+)CD19(+)CD43(+)sIgM(-), PAX5(+), TdT(+), IgH rearranged)/myeloid (CD11b/Mac1(+), c-fms(+), lysozyme(+)) colonies when grown in IL-7- and Flt3 ligand-containing media. Mixed lymphoid/myeloid hyperplasia and hematologic malignancies (most frequently B-cell lymphomas) developed in Mll-AF4 mice after prolonged latency; long latency to malignancy indicates that Mll-AF4-induced lymphoid/myeloid deregulation alone is insufficient to produce malignancy. In contrast, young Mll-AF9 mice had predominately myeloid deregulation in vivo and in vitro and developed myeloid malignancies. The early onset of distinct mixed lymphoid/myeloid lineage deregulation in Mll-AF4 mice shows evidence for both "instructive" and "noninstructive" roles for AF4 and AF9 as partners in MLL fusion genes. The molecular basis for "instruction" and secondary cooperating mutations can now be studied in our Mll-AF4 model.


Figures

Figure 1.
Figure 1.
Construction of the Mll-AF4 KI allele and characterization of targeted ES cells. (A) A diagrammatic description of the KI allele. The top map represents the Mll wild-type allele, indicating the 8-kb fragment detected by N-P1.6 probe. The bottom map represents the Mll-exon7-AF4–targeting allele, indicating the position of the Mll-AF4 breakpoint, PGK-Neo cassette, and a 12-kb fragment detected by N-P1.6 probe in Southern blotting. The Mll-AF4 breakpoint and junction sequence are also shown. (B) Southern blotting analysis of wild-type and targeted ES cells. The 8-kb wild-type (WT) band and 12-kb KI band are indicated. (C) Detection of Mll-AF4 fusion gene by PCR. PCR was performed with gDNA from ES cells with KI allele (lane 1), wild-type ES cells (lane 2), and a representative Mll-AF4 mouse (lane 3). The 5′ primer of Mll exon 6 and 3′ primer of human AF4 amplified a 930-bp Mll-AF4 fragment in lanes 1 and 3. (D) Expression of Mll-AF4 fusion protein in targeted ES cells detected by Western blotting. The 240-kDa Mll-AF4 fusion protein was detected in targeted ES cells. A cell line transfected with MLL-AF4 DNA was used as positive control. (E) Mll-AF4, Mll-AF9, and wild-type mouse at the age of 5 weeks. Mll-AF4 mice have a shortened face and large ears. Mll-AF9 mice have a more pointed face and large ears.
Figure 2.
Figure 2.
Cell types in blood and bone marrow of young wild-type, Mll-AF4, and Mll-AF9 mice. (A) The total numbers of immature cells, monocytes, neutrophils, and lymphocytes in the blood of young wild-type, Mll-AF4, and Mll-AF9 mice. The numbers were calculated by multiplying total WBC counts with percentage of each cell type and expressed as cell numbers per microliter peripheral blood. The error bars represent SEMs. (B) Immunophenotype of nucleated cells in the bone marrow of young Mll-AF4, Mll-AF9, and wild-type mice. Phenotypic analysis of bone marrow cells from representative 5- to 8-week-old Mll-AF4, Mll-AF9, and wild-type mice was performed by FACS.
Figure 3.
Figure 3.
Mll-AF4 marrow progenitor cells expressed myeloid and lymphoid markers (B220, CD43, and CD11b) when grown under pro-B lymphoid conditions. (A) Colonies from young (5- to 8-week-old) mice. Bone marrow cells from wild-type (n = 8), Mll-AF4 (n = 7), and Mll-AF9 (n = 8) mice were plated in methylcellulose medium under lymphoid conditions for 3 generations. The error bars represent SEMs. (B) Representative results of multiparameter FACS analysis on pooled cells from the methylcellulose culture of the third generation under lymphoid conditions.
Figure 4.
Figure 4.
Marrow cells from Mll-AF4 mice expressed additional lymphoid (CD19, PAX5, TdT, DH-JH but not sIgM) and myeloid markers (c-fms and lysozyme) when cultured under pro-B culture conditions. (A) FACS analysis of B220/CD19 and B220/sIgM. (B) PAX5, TdT, c-fms, and lysozyme expression detected by RT-PCR. Lane 1, H2O control; lane 2, mouse spleen cells as control; lanes 3-4, bone marrow cells from 2 Mll-AF4 mice cultured for 21 days. (C) Immunoglobulin DH-JH heavy-chain rearrangement detected by PCR. Lane 1, molecular weight marker; lane 2, mouse spleen DNA as control; lane 3, mouse kidney DNA as control; and lanes 4-5, DNA of bone marrow cells from 2 Mll-AF4 mice cultured for 21 days.
Figure 5.
Figure 5.
Bone marrow cultures under myeloid growth conditions. (A) Myeloid colonies from young mice. Cells from wild-type (n = 6), Mll-AF4 (n = 7), and Mll-AF9 (n = 12) mice were plated in methylcellulose medium under myeloid conditions for 3 generations. (B) Multiparameter FACS analysis on pooled cells from the methylcellulose culture of third-generation cells grown under myeloid conditions. (C) Colony distribution of murine bone marrow cultures under myeloid growth conditions. The frequency of myeloid type I, II, and III colonies was determined from young wild-type, Mll-AF4, and Mll-AF9 mice for 3 generations. The error bars represent SEMs.
Figure 6.
Figure 6.
Kaplan-Meier analysis of the estimated proportion of animals alive and free of hematologic malignancy. The analysis was done on Mll-AF4 (n = 38), Mll-AF9 animals (n = 60), and WT (n = 28). Overall log-rank P < .001.
Figure 7.
Figure 7.
Histopathology and immunohistochemistry of Mll-AF4 mice with leukemia or lymphoma. (A) Spleen section from a representative Mll-AF4 mouse with lymphoma stained with H&E and shown at low magnification demonstrates loss of normal architecture resulting from follicular B-cell lymphoma. Bar represents 200 μm. (B) The same spleen section is shown at high magnification. Bar represents 50 μm. (C) Liver section indicates B220+ lymphoma cell infiltration. Bar represents 50 μm. (D) Liver section from the same specimen shows Bcl-6+ lymphoma. Bar represents 50 μm. (E) Spleen section shows PAX5+ lymphoma cells. Bar represents 50 μm. (F) Small intestine section shows IgM+ lymphoma cells. Bar represents 50 μm. (G) Spleen section from an Mll-AF4 mouse with MPD-like myeloid leukemia stained with H&E indicates loss of normal architecture and heavy infiltration of myeloid cells at all stage of maturation. Bar represents 50 μm. (H) Spleen section from a Mll-AF4 mouse with MPD-like myeloid leukemia stained with myeloperoxidase. Bar represents 50 μm. (I) IgH rearrangements in the spleen and lymph nodes of an Mll-AF4 mouse with follicular B-cell lymphoma. Lane 1, spleen from a wild-type mouse; lane 2, kidney from the same wild-type mouse; lane 3, spleen from an Mll-AF4 mouse; lane 4, lymph node from the same mouse. gDNA was digested by EcoRI. Germline band, 6.5 kb; additional band in lane 2 and lane 3, 7.5 kb.

References

    1. Ziemin-van der Poel S, McCabe NR, Gill HJ, et al. Identification of a gene, MLL, that spans the breakpoint in 11q23 translocations associated with human leukemias. Proc Natl Acad Sci U S A. 1991;88: 10735-10739. - PMC - PubMed
    1. Ayton PM, Cleary ML. Molecular mechanisms of leukemogenesis mediated by MLL fusion proteins. Oncogene. 2001;20: 5695-5707. - PubMed
    1. Armstrong SA, Staunton JE, Silverman LB, et al. MLL translocations specify a distinct gene expression profile that distinguishes a unique leukemia. Nat Genet. 2002;30: 41-47. - PubMed
    1. Chen CS, Sorensen PH, Domer PH, et al. Molecular rearrangements on chromosome 11q23 predominate in infant acute lymphoblastic leukemia and are associated with specific biologic variables and poor outcome. Blood. 1993;81: 2386-2393. - PubMed
    1. Dimartino JF, Cleary ML. Mll rearrangements in haematological malignancies: lessons from clinical and biological studies. Br J Haematol. 1999;106: 614-626. - PubMed

Publication types

Substances