

Review
Update on brain tumor imaging: from anatomy to physiology
Affiliations
- PMID: 16551981
- PMCID: PMC7976984
Item in Clipboard
Review
Update on brain tumor imaging: from anatomy to physiology
AJNR Am J Neuroradiol.
2006 Mar.
No abstract available
Figures
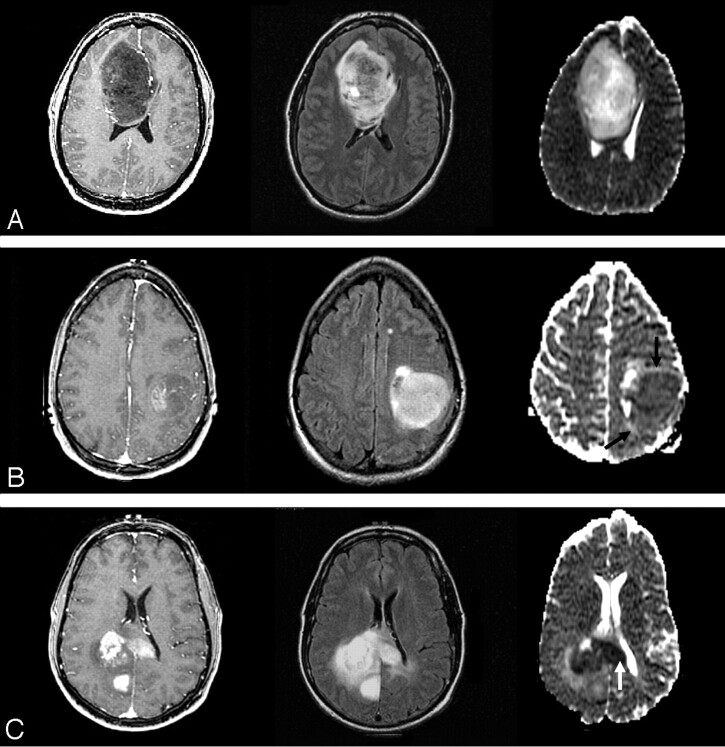
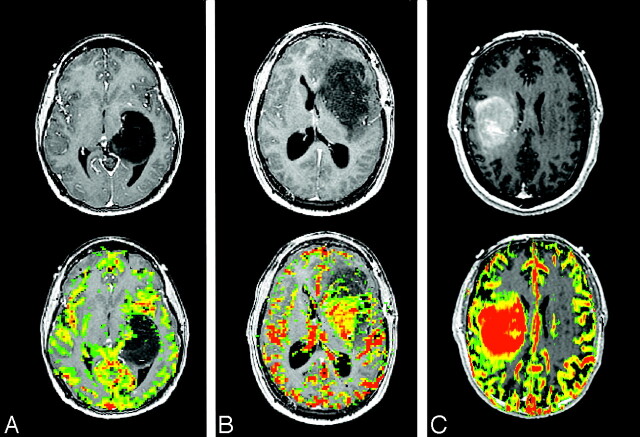
ADC and astrocytoma grade. WHO grade II (top row), grade III (middle row), and grade IV (bottom row) astrocytomas. Axial postcontrast T1-weighted images (left column), FLAIR images (middle column), and ADC maps (right column) demonstrate typical examples of 3 different grades of astrocytoma. With increasing tumor grade, the tumor ADC value of grade III astrocytoma is lower (black arrows) than that of grade II and the grade IV astrocytoma has the lowest (white arrow).
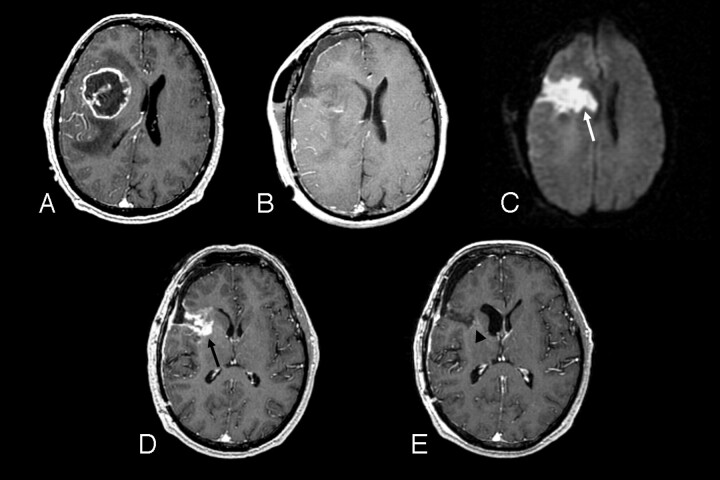
A 51-year-old man with right frontal glioblastoma multiforme. A, Preoperative axial postcontrast T1-weighted image shows a centrally necrotic, peripherally enhancing right frontal lobe mass compressing the adjacent lateral ventricle. B, Immediately postoperative axial postcontrast T1-weighted image confirms gross total resection of the enhancing portion of the mass. C, Immediately postoperative axial diffusion-weighted image demonstrates a wedge-shaped area of abnormal reduced diffusion (white arrow) within the surgical bed. D, One-month postoperative axial postcontrast T1-weighted image reveals irregular area (black arrow) of abnormal contrast enhancement within the margins of the surgical bed simulating the appearance of a recurrent tumor. E, Two-month postoperative axial postcontrast T1-weighted image shows complete resolution of the abnormal contrast enhancement and a gliotic cavity (arrowhead).
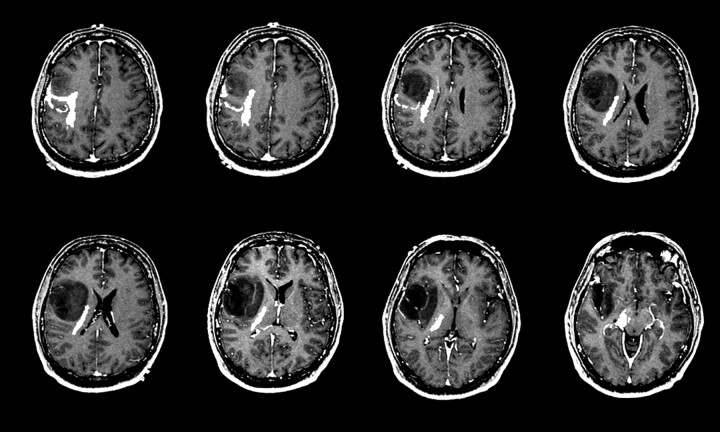
A 37-year-old man with right frontal low-grade astrocytoma. A series of axial postcontrast T1-weighted images of the brain demonstrate a nonenhancing right frontal insular mass. The diffusion tensor tractogram, which has been coregistered and overlaid onto the contrast-enhanced T1-weighted images, demonstrates corticospinal tract (white marks) that is displaced but not invaded by the tumor.
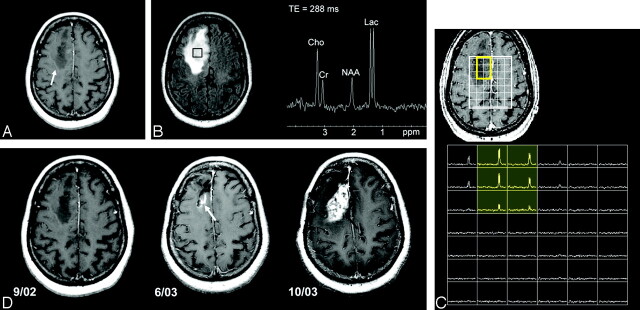
A 59-year-old woman with right superior frontal mass initially diagnosed as low-grade astrocytoma. A, Axial postcontrast T1-weighted image shows an ill-defined nonenhancing mass within the right superior frontal lobe. B, Axial FLAIR image demonstrates homogeneous T2 prolongation within the mass and a single-voxel proton-spectroscopic imaging within the center of the mass reveals a marked increase in lactate (Lac) and choine (Cho) metabolites and a decrease in N-acetylaspartate (NAA) metabolite. C, 3D, lactate-edited, proton spectroscopic image of the same tumor location confirms the presence of lactate metabolite within the tumor. Re-evaluation of the tissue specimen revealed a few mitotic figures and vascular hyperplasia, and the tumor was upgraded to anaplastic astrocytoma. D, Serial axial postcontrast T1-weighted images during 1-year period show emergence of subtle enhancement at the posterior surgical margin at 9-month follow-up (white arrow), which rapidly progresses into an aggressive grade IV astrocytoma (black arrow).
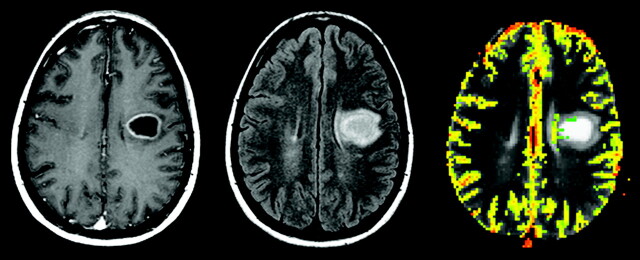
Relative cerebral blood volume (rCBV) maps of astrocytoma grade II, grade III, and grade IV (left to right). Top row, Axial postcontrast T1-weighted images of grade II (left), grade III (middle), and grade IV (right) astrocytoma demonstrate definite contrast enhancement associated with only the grade IV tumor. Bottom row, Axial rCBV color maps coregistered with axial postcontrast T1-weighted image show increasing tumor blood volume abnormality with increasing tumor grade.
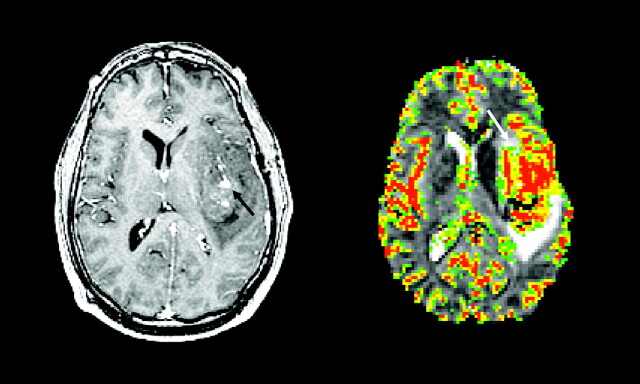
A 34-year-old man with left frontal grade II oligodendroglioma. Axial postcontrast T1-weighted image (left) shows a heterogeneous, mildly enhancing (black arrow) left frontal mass. Axial rCBV map at the same anatomic location demonstrates marked increased in tumor blood volume (white arrow).
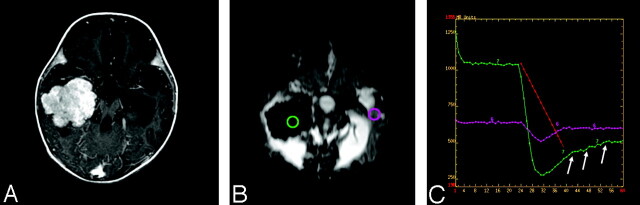
A 5-year-old girl with right lateral ventricle choroids plexus papilloma. A, Axial postcontrast T1-weighted image shows an avidly enhancing, intraventricular mass. B, Dynamic susceptibility-weighted contrast-enhanced image during the maximum bolus demonstrates marked signal intensity drop within the tumor because of increased tumor vascularity. C, Susceptibility-weighted signal intensity time curves from regions of interest placed over the tumor (green) and the contralateral normal brain (pink) show marked difference in signal intensity recovery between the 2 regions. The tumor vasculature lacks blood-brain barrier and there is immediate and marked leakage of contrast agent during the bolus phase (arrows) and minimal return to the baseline.
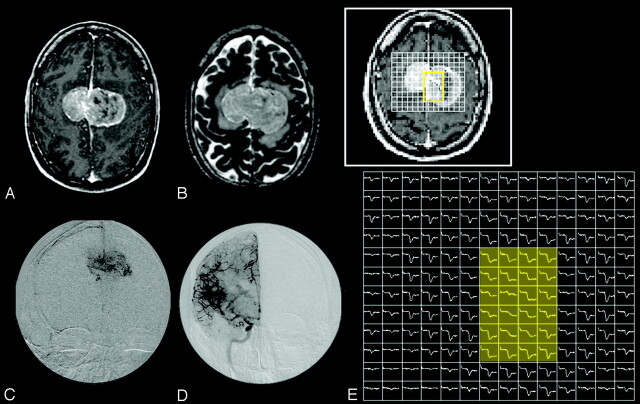
A 42-year-old man with bifalcine meningioma. A and B, Axial postcontrast T1-weighted (A) and T2-weighted (B) images show a large enhancing, bifalcine, extra-axial mass. C and D, Catheter angiographic images from selective external carotid artery (C) and internal carotid artery (D) demonstrate abnormal tumor vascularity. The central aspect of the tumor appears to be supplied predominantly by the external carotid artery. E, 2D array of susceptibility-weighted signal intensity time curve over the tumor shows different patterns of signal intensity recovery. The central region of the tumor (yellow shaded area), which is supplied by the external carotid artery, has markedly lower degree of signal intensity recovery than the tumor periphery supplied by the internal carotid artery.
A 31-year-old woman with left frontal lobe tumefactive demyelinating lesion. Axial postcontrast T1-weighted (left) and FLAIR (middle) images show a rim enhancing left frontal mass. Relative cerebral blood volume map demonstrates lack of increased in blood volume within the lesion.
References
-
- Nolte J. Gross anatomy and general organization of the central nervous system. In: The human brain: an introduction to its functional anatomy. 4th ed. St Louis: Mosby;1999. :51–75
-
- Daumas-Duport C, Beuvon F, Varlet P, et al. [Gliomas: WHO and Sainte-Anne Hospital classifications]. Ann Pathol 2000;20:413–28 - PubMed
-
- Bulakbasi N, Guvenc I, Onguru O, et al. The added value of the apparent diffusion coefficient calculation to magnetic resonance imaging in the differentiation and grading of malignant brain tumors. J Comput Assist Tomogr 2004;28:735–46 - PubMed
-
- Kitis O, Altay H, Calli C, et al. Minimum apparent diffusion coefficients in the evaluation of brain tumors. Eur J Radiol 2005;55:393–400 - PubMed
Publication types
MeSH terms
Grants and funding
LinkOut - more resources
Full Text Sources
Medical