. 2006 Mar;27(3):533-47.

MR imaging, MR spectroscopy, and diffusion tensor imaging of sequential studies in neonates with encephalopathy

Affiliations

MR imaging, MR spectroscopy, and diffusion tensor imaging of sequential studies in neonates with encephalopathy

A J Barkovich et al. AJNR Am J Neuroradiol. 2006 Mar.

Abstract

Background: Although the imaging, spectroscopic, and diffusion characteristics of brains of infants with neonatal encephalopathy have been described, the time course during which these changes evolve is not clear. The results of sequential MR imaging studies--including anatomic MR imaging, proton MR spectroscopy, and diffusion tensor imaging (DTI)--of 10 patients enrolled prospectively in a study of neonatal encephalopathy are reported to help to clarify the time course of changes in different brain regions during the first 2 weeks of life.

Methods: Ten neonates were prospectively enrolled in a study of the evolution of MR findings in neonatal encephalopathy and were studied 2 (8 patients) or 3 (2 patients) times within the first 2 weeks of life. The MR examination included spin-echo T1 and T2-weighted images, DTI, and long echo time (288 milliseconds) proton MR spectroscopy. Diffusion parameters (diffusivity [D(av)], fractional anisotropy [FA], and individual eigenvalues) were calculated for 10 1-cm2 regions of interest in each hemisphere that were placed based on anatomic landmarks. D(av) and FA were then measured manually in the same areas on a workstation. Metabolite ratios (NAA/Ch, Cr/Ch, Cr/NAA, Lac/Ch, and Lac/NAA) were calculated in 7 regions of interest. Imaging appearance, diffusion parameters, and metabolite ratios were then evaluated longitudinally (comparing with other studies on the same patient at different times) and cross-sectionally (comparing all studies performed on the same postnatal day).

Results: In most of the patients a characteristic evolution of DTI and MR spectroscopy parameters was seen during the first 2 weeks after birth. Although the anatomic images were normal or nearly normal on the first 2 days after birth in most patients, abnormalities were detected on DTI (both visually and by quantitative interrogation of D(av) maps) and proton MR spectroscopy (abnormal metabolite ratios). These parameters tended to worsen until about day 5 and then normalize, though in several patients abnormal metabolite ratios persisted. Of interest, as areas of abnormal diffusivity pseudonormalized within one region of the brain they would develop in other areas. Therefore, the pattern of injury looked very different when imaging was performed at different times during this evolution.

Conclusion: Patterns of injury detected by standard anatomic imaging sequences, DTI sequences, and proton MR spectroscopy varied considerably during the first 2 weeks after injury. The appearance of new areas of reduced diffusion simultaneous with the pseudonormalization of areas that had reduced diffusion at earlier times can result in an entirely different pattern of injury on diffusivity maps acquired at different time points. Awareness of these evolving patterns is essential if studies are performed and interpreted during this critical period of time.


Figures

Fig 1.
Fig 1.
Locations of regions of interest for DTI and MRSI measurements are marked by rectangles. A, Squares showing region of interest locations from which proton spectra ratios were acquired and calculated by automated processing after each MR study of every patient. B, Squares and rectangles showing the 18 regions of interest from which Dav and FA values were calculated by automated processing.
Fig 1.
Fig 1.
Locations of regions of interest for DTI and MRSI measurements are marked by rectangles. A, Squares showing region of interest locations from which proton spectra ratios were acquired and calculated by automated processing after each MR study of every patient. B, Squares and rectangles showing the 18 regions of interest from which Dav and FA values were calculated by automated processing.
Fig 2.
Fig 2.
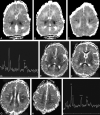
Patient 163. Increasing abnormality from day 1 to day 3. A and B, Axial Dav maps at age 22 hours (day 1) show reduced diffusion in the ventrolateral thalami (arrows) and normal-appearing mesial temporal lobes in the region of the uncus. C, Proton MR spectroscopy from left thalamus at 22 hours shows elevated lactate peak (Lac) and normal appearing NAA peak. The peak upfield from lactate is propane diol (ethylene glycol), which is administered as the base for antiseizure medications. D and E, Axial Dav maps at age 64 hours (day 3) show more extensive reduced diffusivity. The mesial temporal lobes (D, white arrows) show reduced Dav, as do the cingula (E, black arrows) and the entire basal ganglia-thalami-insular region (E, white arrows). F, Proton MR spectroscopy from left thalamus at 64 hours shows interval increase in lactate and decrease in NAA and choline (Ch) compared with creatine (Cr).
Fig 3.
Fig 3.
Patient 170. Increasing abnormality from day 2 to day 3. A, Axial Dav map at age 34 hours shows extensive reduced diffusion in the lateral thalami (T) and, to a lesser extent, in the posterior left putamen (white arrow). B, Proton MR spectroscopy from the left thalamus at 34 hours is most remarkable for a moderate lactate peak (arrow). C, Axial Dav map at age 61 hours shows that extensive reduced diffusivity has developed within the putamina (arrows). D, Proton MR spectroscopy from the left thalamus at 61 hours shows a marked increase in lactate compared with NAA and choline.
Fig 4.
Fig 4.
Patient 178. Evolution of T1, diffusivity, and metabolites over 3 scans during 8 days. AC were performed at day 1 (16 hours), DF were performed at 4 days (84 hours), and GI were performed at 8 days (178 hours). A, Axial T1-weighted image at age 16 hours is normal. B, Axial Dav map at age 16 hours shows a small amount of reduced diffusivity on the ventrolateral thalami (arrows). Measurements showed a reduction in Dav of about 10%. C, Proton MR spectroscopy from the right thalamus at age 16 hours shows minimal elevation of lactate (Lac), but is otherwise normal. D, Axial T1-weighted image at 84 hours shows that the normal hyperintensity in the posterior limb of the internal capsule is no longer seen. Abnormal hyperintensity is seen in the ventrolateral thalami and posterior putamina. E, Axial Dav map at 84 hours shows that reduced diffusivity is now present in the posterior putamina (arrows). Measurements of Dav showed significant reduction since day 1, with values now 50%–60% or normal (40%–50% reduced) in the thalami and putamina, and dorsal brain stem. Lesser reductions of about 25% were found in the cerebral hemispheric white matter. F, Proton MR spectroscopy from the right thalamus at 84 hours shows an increase in lactate (Lac) and relative reduction of choline and NAA compared with the first study. G, Axial T1-weighted image at 8 days shows that the T1 shortening is becoming less diffuse and more globular (arrows), with the globular regions being located in the globi pallidi, ventrolateral thalami, and at the junction of the anterior globi pallidi and putamina. H, Axial Dav map at 84 hours shows that reduced diffusivity is now almost exclusively seen in the posterior putamina (arrows) with the thalamic abnormality nearly completely gone. Measurements showed that the Dav values of the putamina were still about 30% below normal, but those in the thalami had normalized. I, Proton MR spectroscopy from the right thalamus at 8 days shows that the lactate peak has gotten significantly smaller. Note that the NAA and choline peaks have continued to decrease in size compared with the creatine peak.
Fig 5.
Fig 5.
Patient 193. New involvement of white matter pathways on second study. Studies performed at day 2 and day 7. AC, Axial Dav maps at 34 hours show reduced diffusivity (Dav reduced by about 50%, black arrows) in the ventrolateral thalami, posterior limbs of internal capsules, and corticospinal tracts in centrum semiovale. No other areas of reduced diffusivity are identified. D, Proton MR spectroscopy from the left basal ganglia at 34 hours shows mild lactate (Lac) elevation. EH, Axial Dav maps at 148 hours show that diffusivity in the deep gray nuclei has normalized (values were within 5% of normal); however, new areas of reduced diffusivity are seen in what are believed to be the optic radiations (E, medium white arrows), corpus callosum (F, small white arrows; G, smaller white arrows), cingulum (H, medium white arrows), and superior longitudinal fasciculus (G, larger arrows). I, Proton MR spectroscopy from left basal ganglia at 148 hours shows that lactate (Lac) has increased in comparison with NAA, choline, and creatine. NAA is the most reduced metabolite.
Fig 6.
Fig 6.
Patient 154. Increased volume of injury in vascular boundary zones from 2 to 4 days. A and B, Axial Dav maps at 49 hours show reduced diffusivity (Dav reduced by about 20%, black arrows) in the frontal and parietooccipital intervascular boundary zones. Note also some reduced diffusivity in the posterolateral thalami (white arrows). C, Proton MR spectroscopy from the left frontal white matter at 49 hours shows mild lactate (Lac) elevation. D and E, Axial Dav maps at 91 hours show more extensive reduced diffusivity in the frontal and parieto-occipital intervascular boundary zones and new reduced diffusivity along the optic radiations (black arrows). Dav values were not significantly changed from the prior study at 49 hours. F, Although the proton MR spectrum does not look significantly changed, measurements showed a 16% decrease in Lac/NAA and a 36% decrease in Lac/Ch in the frontal white matter compared with the study at 49 hours.

References

    1. Groenendaal F, Veenhoven EH, van der Grond J, et al. Cerebral lactate and N-acetyl-aspartate/choline ratios in asphyxiated full-term neonates demonstrated in-vivo using proton magnetic resonance spectroscopy. Pediatr Res 1994;35:148–51 - PubMed
    1. Preden CJ, Rutherford MA, Sargentoni J, et al. Proton spectroscopy of the neonatal brain following hypoxic-ischemic injury. Dev Med Child Neurol 1993;35:502–10 - PubMed
    1. Bryant DJ, Sargentoni J, Cox IJ, et al. Proton magnetic resonance spectroscopy of term infants with hypoxic ischaemic injury. In: Proceedings of the Society of magnetic resonance. San Francisco;1994;336
    1. Hanrahan JD, Sargentoni J, Azzopardi D, et al. Cerebral metabolism within 18 hours of birth asphyxia: a proton magnetic resonance spectroscopy study. Pediatr Res 1996;39:584–90 - PubMed
    1. Rutherford M, Pennock J, Schwieso J, et al. Hypoxic ischaemic encephalopathy: early and late magnetic resonance findings in relation to outcome. Arch Dis Child Fetal Neonatal Ed 1996;75:F145–F151 - PMC - PubMed

Publication types