Review
. 2006 Jan 29;361(1465):173-94.
doi: 10.1098/rstb.2005.1737.

Nature's green revolution: the remarkable evolutionary rise of C4 plants

Affiliations
Review

Nature's green revolution: the remarkable evolutionary rise of C4 plants

Colin P Osborne et al. Philos Trans R Soc Lond B Biol Sci. .

Abstract

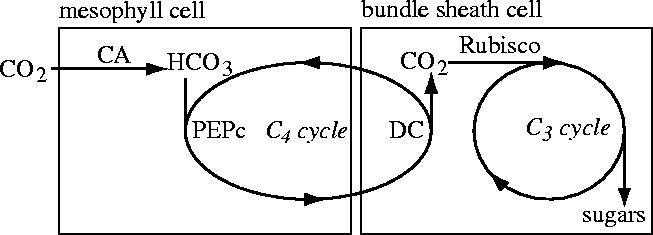
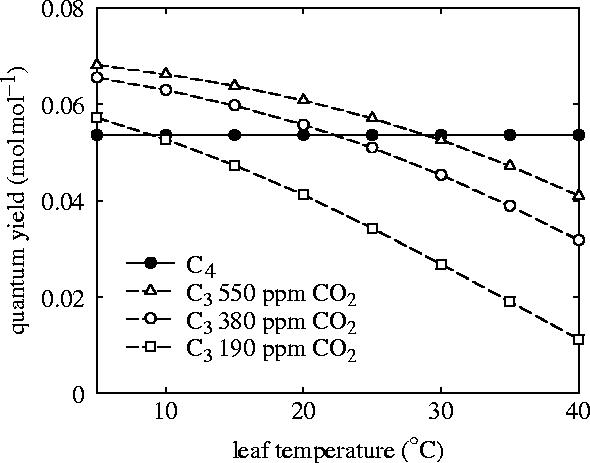
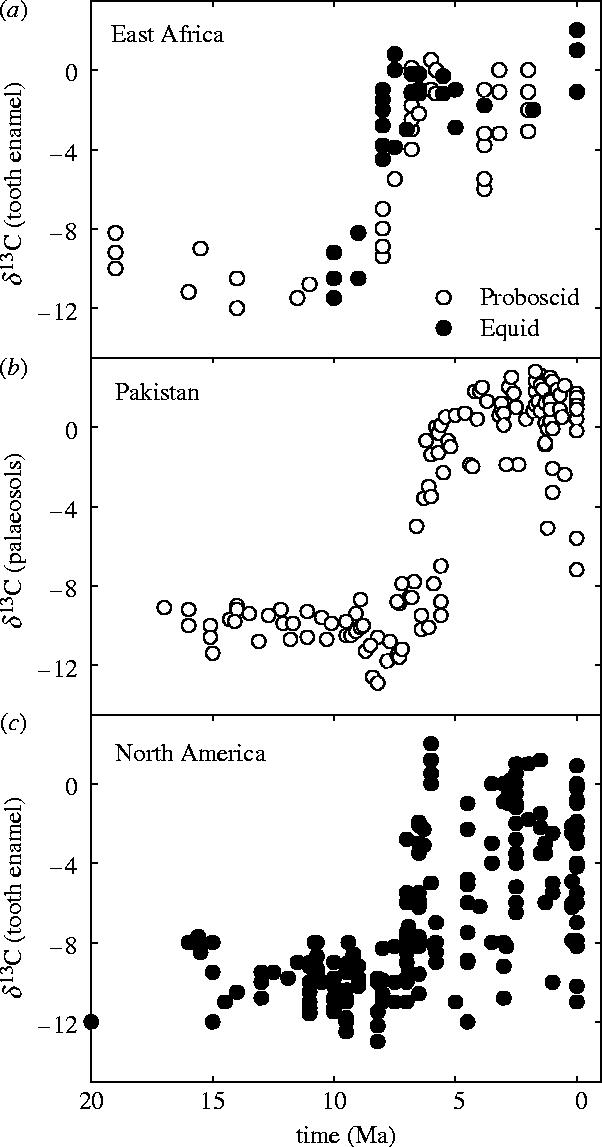
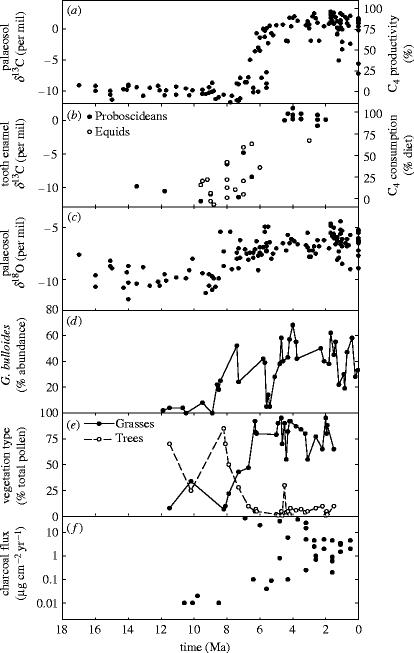
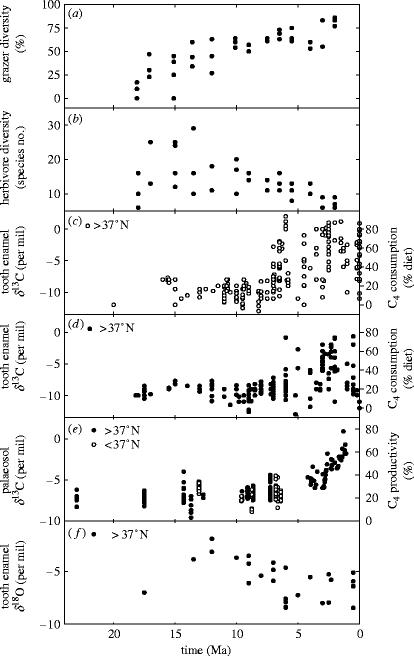
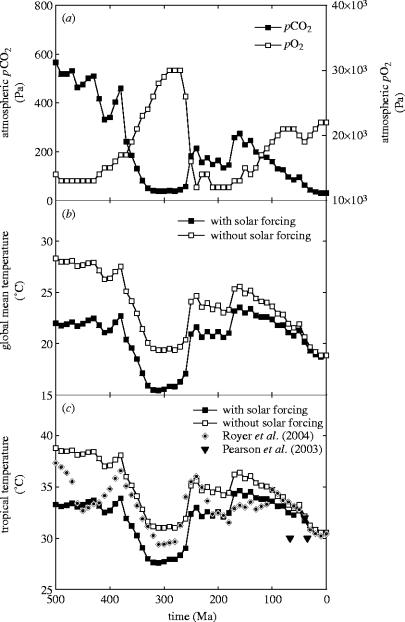
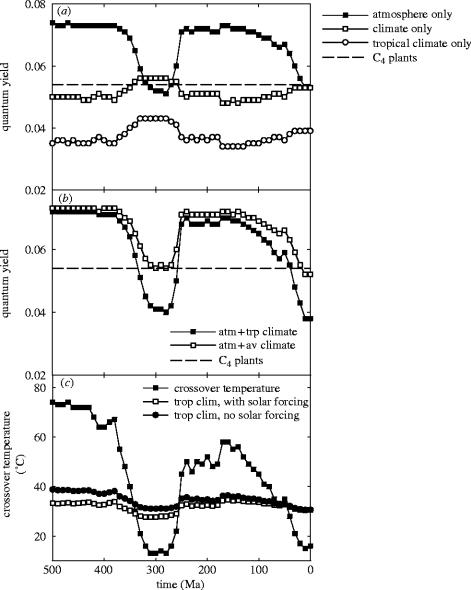
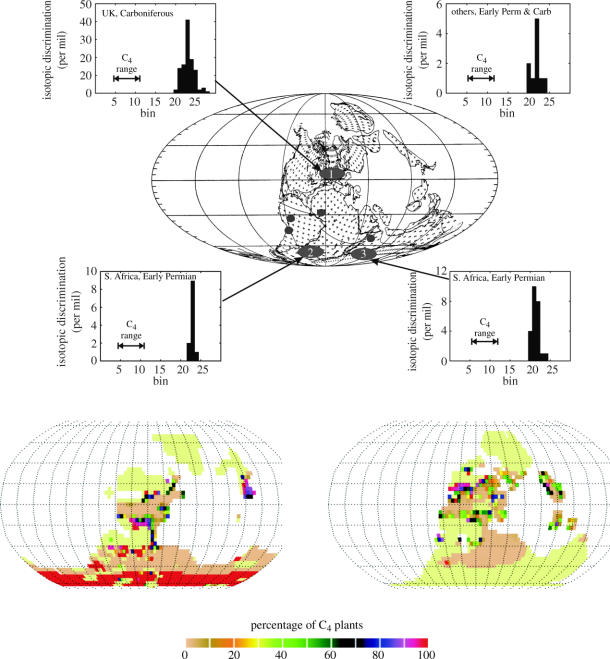
Plants with the C4 photosynthetic pathway dominate today's tropical savannahs and grasslands, and account for some 30% of global terrestrial carbon fixation. Their success stems from a physiological CO2-concentrating pump, which leads to high photosynthetic efficiency in warm climates and low atmospheric CO2 concentrations. Remarkably, their dominance of tropical environments was achieved in only the past 10 million years (Myr), less than 3% of the time that terrestrial plants have existed on Earth. We critically review the proposal that declining atmospheric CO2 triggered this tropical revolution via its effects on the photosynthetic efficiency of leaves. Our synthesis of the latest geological evidence from South Asia and North America suggests that this emphasis is misplaced. Instead, we find important roles for regional climate change and fire in South Asia, but no obvious environmental trigger for C4 success in North America. CO2-starvation is implicated in the origins of C4 plants 25-32 Myr ago, raising the possibility that the pathway evolved under more extreme atmospheric conditions experienced 10 times earlier. However, our geochemical analyses provide no evidence of the C4 mechanism at this time, although possible ancestral components of the C4 pathway are identified in ancient plant lineages. We suggest that future research must redress the substantial imbalance between experimental investigations and analyses of the geological record.


Figures

Figure 1
Figure 1
Simple schematic diagram of the C4 photosynthetic pathway showing compartmentalization of the different enzyme systems involved, and the connection between CO2-pumping by the C4 cycle and CO2-fixation by the C3 cycle. Abbreviations: CA, carbonic anhydrase; HCO3, bicarbonate; PEPc, phosphoenolpyruvate carboxylase; DC, decarboxylase enzyme(s); Rubisco, ribulose-1,5-bisphosphate carboxylase/oxygenase.
Figure 2
Figure 2
Modelled interaction between temperature and CO2 on the photosynthetic quantum yields (maximum light-use efficiencies) of C3 and C4 plants. Notice that the temperature at which C3 and C4 quantum yields cross over declines with falling atmospheric CO2 concentration.
Figure 3
Figure 3
Increase in δ13C from palaeosols and tooth enamel showing apparent synchronicity in the transition to C4-dominated terrestrial ecosystems across continents. Data for (a) from Cerling et al. (1997), (b) from Quade & Cerling (1995) and (c) from Passey et al. (2002).
Figure 4
Figure 4
Atmospheric CO2 trends over the past 35 Myr, as reconstructed from three different proxies (data from Pagani et al. 1999; Pearson & Palmer 2000; Royer et al. 2001).
Figure 5
Figure 5
Geological evidence from the Indian subcontinent of ecosystem dynamics and climate change through the Late Miocene and Pliocene: (a) δ13C of palaeosol carbonates (data from Quade & Cerling 1995) and inferred C4 plant productivity (following Fox & Koch 2003), (b) δ13C of tooth enamel from Equids (horses) and Proboscideans (elephant-like mammals) (data from Quade & Cerling 1995) and the inferred proportion of diet comprised of C4 plant biomass (following Passey et al. 2002), (c) δ18O of palaeosol carbonates (data source as (a)), (d) abundance of Globigerinoides bulloides in the Arabian Sea (data from Zhisheng et al. 2001), (e) vegetation type inferred from pollen abundance (data from Hoorn et al. 2000), and (f) charcoal flux to North Pacific sediments (data from Keeley & Rundel 2003).
Figure 6
Figure 6
Geological evidence from the Great Plains of North America of ecosystem dynamics and climate change through the Late Miocene and Pliocene. Data sources are: (a) and (b) Janis et al. (2000); (c) Cerling et al. (1997), Latorre et al. (1997) and Passey et al. (2002), (d) Cerling et al. (1997) and Passey et al. (2002), (e) Fox & Koch (2003), and (f) MacFadden et al. (1999) and Passey et al. (2002).
Figure 7
Figure 7
Variations in: (a) the partial pressure of atmospheric CO2 and O2 over the past 500 Myr of the Phanerozoic, (b) calculated changes in global mean surface temperature, and (c) calculated changes in the tropics. Also shown in (c) are estimates of tropical temperatures from oxygen isotope ratios of fossil foraminifera shells (Pearson et al. 2001) and calculations from marine calcium carbonate fossils (Veizer et al. 2000) corrected for the CO2-effects on ocean pH (Royer et al. 2004).
Figure 8
Figure 8
Calculated changes in: (a) quantum yield of C3 and C4 plants through the past 500 Myr of the Phanerozoic, (b) the effects of CO2 in combination with either tropical climate (filled squares) or global mean climate (open squares) on quantum yield, and (c) the calculated crossover temperature for C4 and C4 plants in comparison with the tropical climate (with and without the effects of solar forcing) shown in figure 7.
Figure 9
Figure 9
Simulated global distribution of C4 plants using a generalized dynamic global vegetation model (Beerling & Woodward 2001) and either the land surface climatology from the UGAMP (lower left map) or NCAR (lower right map) GCMs. Central picture shows the palaeogeography of the Late Carboniferous (Westphalian; Scotese & McKerrow 1990) and the main regions/localities from which fossil plants were sampled for stable carbon isotope analysis (see appendix A for details). The frequency histograms depict the calculated values of carbon isotope discrimination and, for comparison, the values expected if plants operated with the C4 photosynthetic pathway.
Figure 10
Figure 10
Photographic evidence showing the incorporation of 14C-labelled malate into insoluble compounds in leaves of (a) Osmunda regalis and (b) Ginkgo biloba (Palmer & Quick, unpublished data). Note the 14C activity concentrated around vascular tissues.

References

    1. Beerling D.J. Evolutionary responses of land plants to atmospheric CO2. In: Ehleringer J.R, Cerling T.E, Dearing D.M, editors. A history of atmospheric CO2 and its effects on plants, animals and ecosystems. Ecological studies. vol. 177. Springer; Berlin: 2005. pp. 114–132.
    1. Beerling D.J, Woodward F.I. Modelling the first 400 million years. Cambridge University Press; Cambridge, UK: 2001. Vegetation and the terrestrial carbon cycle.
    1. Bekker A, Holland H.D, Wang P.L, Rumble D, Stein H.J, Hannah J.L, Coetzee L.L, Beukes N.J. Dating the rise of atmospheric oxygen. Nature. 2004;427:117–120. doi:10.1038/nature02260 - DOI - PubMed
    1. Berner R.A. CO2 and O2. Oxford University Press; Oxford, UK: 2005. The Phanerozoic carbon cycle.
    1. Björkman O. Comparative photosynthetic CO2 exchange in higher plants. In: Hatch M.D, Osmond C.B, Slayter R.O, editors. Photosynthesis and photorespiration. Academic Press; San Diego, CA: 1971. pp. 18–32.

Publication types

LinkOut - more resources