

Bayesian spatial analysis and disease mapping: tools to enhance planning and implementation of a schistosomiasis control programme in Tanzania
- PMID: 16553932
- PMCID: PMC2202922
- DOI: 10.1111/j.1365-3156.2006.01594.x
Bayesian spatial analysis and disease mapping: tools to enhance planning and implementation of a schistosomiasis control programme in Tanzania
Abstract
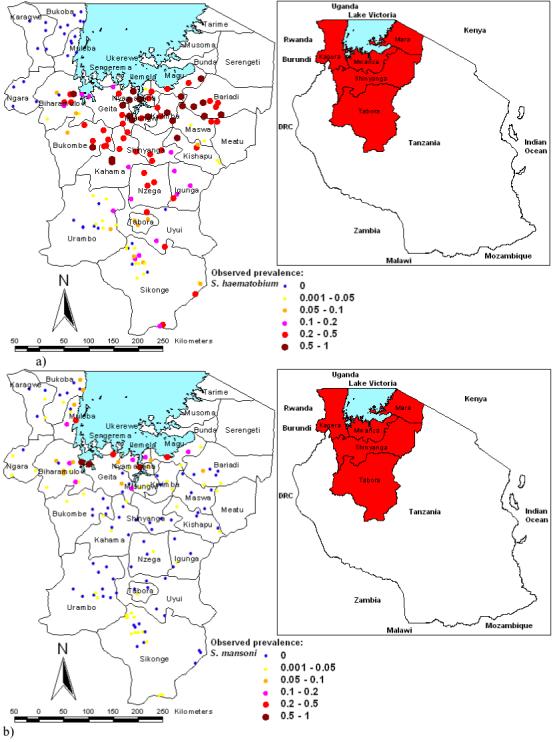
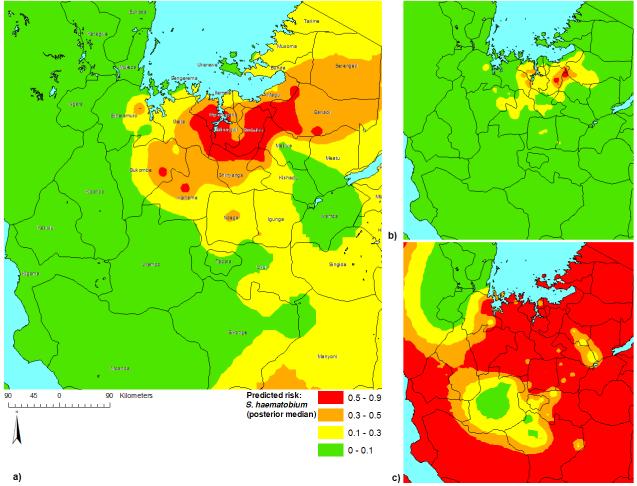
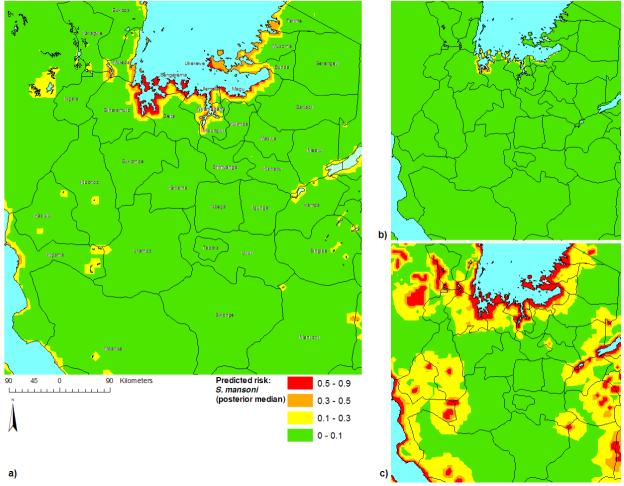
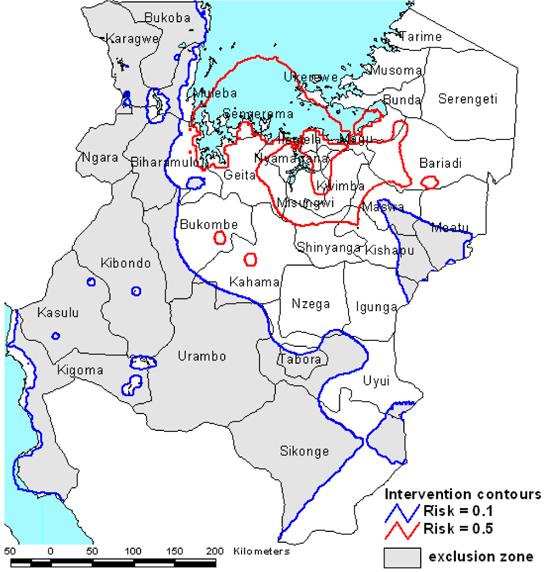
Objective: To predict the spatial distributions of Schistosoma haematobium and S. mansoni infections to assist planning the implementation of mass distribution of praziquantel as part of an on-going national control programme in Tanzania.
Methods: Bayesian geostatistical models were developed using parasitological data from 143 schools.
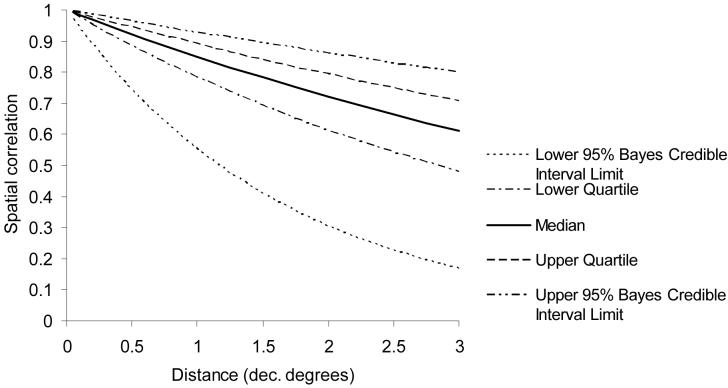
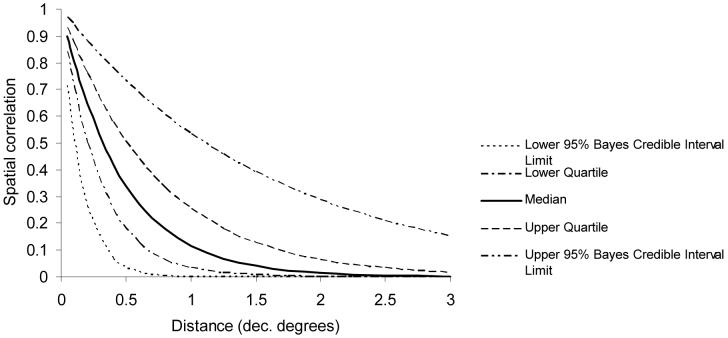
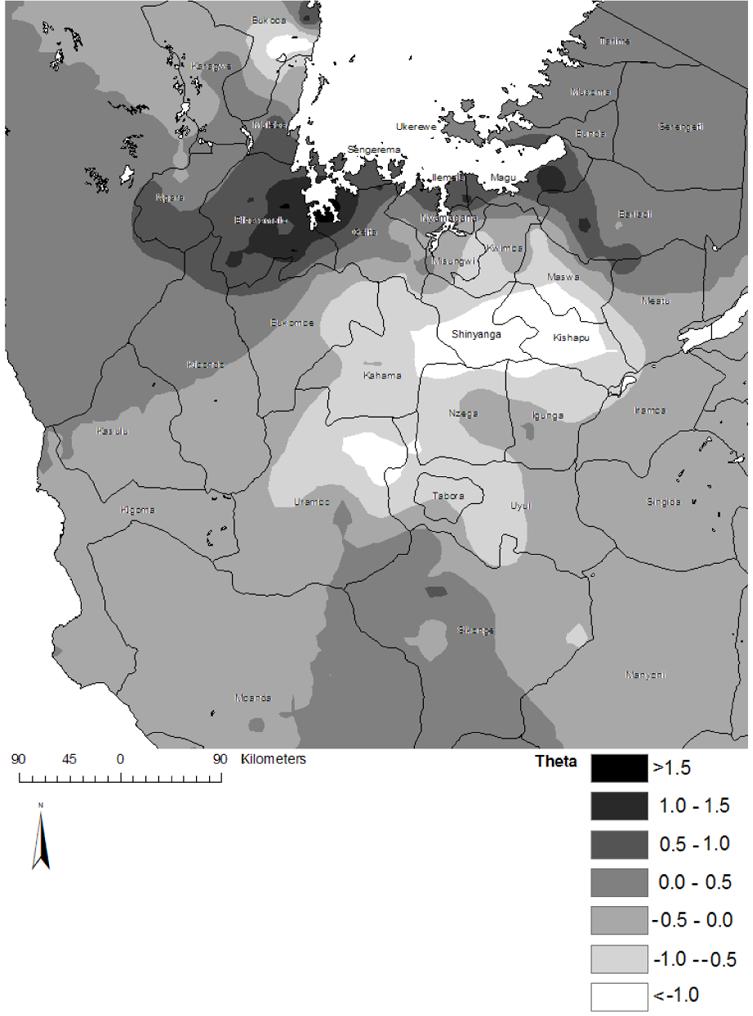
Results: In the S. haematobium models, although land surface temperature and rainfall were significant predictors of prevalence, they became non-significant when spatial correlation was taken into account. In the S. mansoni models, distance to water bodies and annual minimum temperature were significant predictors, even when adjusting for spatial correlation. Spatial correlation occurred over greater distances for S. haematobium than for S. mansoni. Uncertainties in predictions were examined to identify areas requiring further data collection before programme implementation.
Conclusion: Bayesian geostatistical analysis is a powerful and statistically robust tool for identifying high prevalence areas in a heterogeneous and imperfectly known environment.
Figures
References
-
- Agumya A, Hunter GJ. Responding to the consequences of uncertainty in geographical data. International Journal of Geographical Information Science. 2002;16:405–417.
-
- Alexander N, Moyeed R, Stander J. Spatial modelling of individual-level parasite counts using the negative binomial distribution. Biostatistics. 2000;1:453–463. - PubMed
-
- Anderson RM, May RM. Infectious Diseases of Humans: dynamics and control. Oxford: Oxford University Press; 1991.
-
- Appleton CC. Review of Literature on abiotic factors influencing the distribution and life-cycles of Bilharziasis intermediate host snails. Malacological Review. 1978;11:1–25.
-
- Best N, Richardson S, Thomson A. A comparison of Bayesian spatial models for disease mapping. Statistical Methods in Medical Research. 2005;14:35–59. - PubMed
Publication types
MeSH terms
Substances
Grants and funding
LinkOut - more resources
Full Text Sources
