. 2006 Mar 22;26(12):3345-56.
doi: 10.1523/JNEUROSCI.5186-05.2006.

System Xc- and apolipoprotein E expressed by microglia have opposite effects on the neurotoxicity of amyloid-beta peptide 1-40

Affiliations

System Xc- and apolipoprotein E expressed by microglia have opposite effects on the neurotoxicity of amyloid-beta peptide 1-40

Si Qin et al. J Neurosci. .

Abstract

Because senile plaques in Alzheimer's disease (AD) contain reactive microglia in addition to potentially neurotoxic aggregates of amyloid-beta (Abeta), we examined the influence of microglia on the viability of rodent neurons in culture exposed to aggregated Abeta 1-40. Microglia enhanced the toxicity of Abeta by releasing glutamate through the cystine-glutamate antiporter system Xc-. This may be relevant to Abeta toxicity in AD, because the system Xc(-)-specific xCT gene is expressed not only in cultured microglia but also in reactive microglia within or surrounding amyloid plaques in transgenic mice expressing mutant human amyloid precursor protein or in wild-type mice injected with Abeta. Inhibition of NMDA receptors or system Xc- prevented the microglia-enhanced neurotoxicity of Abeta but also unmasked a neuroprotective effect of microglia mediated by microglial secretion of apolipoprotein E (apoE) in the culture medium. Immunodepletion of apoE or targeted inactivation of the apoE gene in microglia abrogated neuroprotection by microglial conditioned medium, whereas supplementation by human apoE isoforms restored protection, which was potentiated by the presence of microglia-derived cofactors. These results suggest that inhibition of microglial system Xc- might be of therapeutic value in the treatment of AD. Its inhibition not only prevents glutamate excitotoxicity but also facilitates neuroprotection by apoE.


Figures

Figure 1.
Figure 1.
Effects of Aβ on the survival of neurons cultured with or without microglial cells. Neurons derived from E17 rat cerebral cortex were cultured for 6 d with or without Aβ or microglia that were present during the last 2 d in the cultures. A–C, Triple fluorescent staining with mouse anti-MAP2 antibody (Alexa green), isolectin B4 (Alexa red), and Hoechst 33342 (blue) in untreated neuronal cultures (A) or cultures treated with 20 μg/ml Aβ 1–40 (B) or 2.5 μg/ml Aβ 1–40 in the presence of microglia (C). Hoechst staining shows nuclei in cell corpses that display no MAP2 immunoreactivity. Arrowheads in C point to cell corpses engulfed by microglial cells. Scale bar, 20 μm. D, E, Pure neuronal cultures (D) and neuron–microglia cocultures (E) were treated with the indicated concentrations of Aβ 1–40 or Aβ 40–1 before quantification of neuron survival by ELISA determination of MAP2 levels (MAP2 O.D.). The MAP2 O.D. is expressed as a percentage of the mean control value determined in the cultures without Aβ and defined as 100%. Data are means ± SD from four to five determinations in sister wells from three independent experiments. The asterisk indicates significant difference between untreated and Aβ-treated cultures (*p < 0.01; one-way ANOVA followed by Dunnett's test).
Figure 2.
Figure 2.
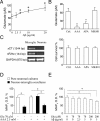
System Xc expression and release of neurotoxic glutamate by microglia in the presence of Aβ. A, Aβ stimulates a dose-dependent release of glutamate by microglia. Purified microglial cells (4 × 10⁴ cells per 100 μl of medium) were incubated for 2 d with increasing concentrations of Aβ before measuring glutamate concentrations in the culture medium. Data are means ± SD from six determinations in sister wells from three independent experiments. The asterisk indicates significant difference between untreated and Aβ-treated cultures (*p < 0.01; one-way ANOVA followed by Dunnett's test.). B, Effect of system Xc blockers on glutamate release and cell survival in pure microglial cultures exposed to Aβ. Cells were incubated for 2 d with 2.5 μg/ml Aβ in the absence (Ctrl.) or the presence of 2.5 mm AAA, 2.5 mm APA, or 2.5 μm MK801 before assessment of glutamate release or cell survival measured by calcein fluorescence. Results are expressed as the percentage of the mean value in control cultures. Data are means ± SD from three or six determinations in sister wells from three independent experiments. The asterisk indicates significant difference between control (Ctrl.) and cultures treated with AAA or APA (*p < 0.001; one-way ANOVA followed by Tukey–Kramer multiple comparisons test). C, Ethidium bromide-stained agarose gels showing reverse transcription-PCR products generated from xCT, 4F2hc, and GAPDH mRNA in 5 DIV neuronal cultures or in microglial cells cultured for 24 h after purification. Cultures were treated with 2.5 μg/ml Aβ for the last 24 h. D, E, Role of microglial system Xc and glutamate in neuronal death in the presence of Aβ. D, Cultured neurons were grown for 4 d and then treated for 2 d with 2.5 μg/ml in the absence (pure neuronal cultures) or presence of microglia (neuron–microglia cocultures) before quantification of neuron survival by ELISA determination of MAP2 levels. When indicated, AAA (2.5 mm) and glutamate (Glu 70 μm) were added to the medium together with Aβ. The MAP2 O.D. is expressed as the percentage of the mean control value determined in pure neuronal cultures without AAA defined as 100%. E, Four-day-old pure neuronal cultures were treated for 2 d with or without indicated doses of glutamate and Aβ. MAP2 O.D. is expressed as the percentage of untreated neuronal cultures. Data are means ± SD from five determinations in sister wells from two independent experiments. The asterisk indicates significant difference (*p < 0.01; one-way ANOVA followed by Tukey–Kramer multiple comparisons test).
Figure 3.
Figure 3.
Inhibition of system Xc or NMDA receptors in cultures exposed to Aβ 1–40 prevents the neurotoxic effect of microglia and unmask their neuroprotective potential. Cultured neurons were grown for 4 d and then treated for 2 d with 2.5 μg/ml or 20 μg/ml Aβ (Aβ 2.5 or Aβ 20) in the absence or the presence of microglia before quantification of neuron survival by ELISA determination of MAP2 levels (MAP2 O.D.). Cultures were performed in standard CDM (containing 0.2 mm cystine) (A), standard CDM supplemented for the last 2 d with AAA (2.5 mm) (B), APA (2.5 mm) (C), MK801 (2.5 μm) (E), or APV (50 μm) (F), or CDM with 10 μm cystine and 100 μm cysteine (low cystine) (D). In each graph, the MAP2 O.D. in pure neuronal cultures (open bars) or in neuron–microglia cocultures (filled bars) is expressed as the percentage of the mean value determined in pure neuronal cultures treated with 2.5 μg/ml Aβ defined as 100%. Data are mean ± SD from five determinations in sister wells from five (A, B), three (C, D), four (E), or two (F) independent experiments. The asterisk indicates significant difference between pure neuronal and neuron–microglia cocultures (*p < 0.01; one-way ANOVA followed by Tukey–Kramer multiple comparison test).
Figure 4.
Figure 4.
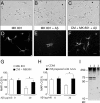
Effects of microglial conditioned medium on neuronal cultures exposed to Aβ. A–H, Four DIV neuronal cultures were treated for 2 d with or without 20 μg/ml Aβ and/or CM recovered from pure microglia cultures incubated for 2 d without (A–G) or with (H) 2.5 mm AAA. MK801 (2.5 μm) was also added to 4 DIV neuronal cultures when assessing the effect of CM prepared without AAA (A–G). A–F, Optical fields of 6 DIV pure neuronal cultures treated for the last 2 d with MK801 and in the absence (A, D) or the presence (B, E) of 20 μg/ml Aβ or 20 μg/ml Aβ and CM (C, F). A–C, Phase contrast views of living cultures. Arrowheads in B and C point to Aβ deposits. D–F, Fluorescent staining with anti-MAP 2 antibody (Alexa green). Scale bar, 20 μm. G, Quantification of neuronal survival by determination of MAP2 levels in 6 DIV cultures that were treated with MK801 and incubated with or without 20 μg/ml Aβ, CM, or Aβ plus CM. Cultures without CM were supplemented with the same volume of unconditioned CDM (see Materials and Methods). The MAP2 O.D. is expressed as the percentage of the mean value in pure neuronal cultures without Aβ and CM set at 100%. Filled bars correspond to CM-treated cultures. Data are means ± SD from five determinations in sister wells from six independent experiments. H, Assessment of neuronal survival in cultures treated as in G but without MK801 and using CM derived from microglia treated with 2.5 mm AAA (means ± SD from five determinations from two independent experiments). The asterisk indicates significant difference (*p < 0.001; one-way ANOVA followed by Tukey–Kramer multiple comparisons test). I, Western blot analysis of Aβ incubated in culture media. Aβ (0.4 μg/ml) was incubated overnight at 37°C in CDM (lane 1), CM (lane 2), or with 1 μg/ml proteinase K (lane 3). Samples (13 μl) of each medium were separated by SDS-PAGE and probed with polyclonal anti-Aβ antibodies that were visualized by enhanced chemiluminescence.
Figure 5.
Figure 5.
Microglial expression of the apoE gene. A, Ethidium bromide-stained agarose gel of reverse transcription-PCR products generated from apoE and GAPDH mRNA in 5 DIV pure neurons (neu.) or in purified microglial cells cultured for 24 h in the absence (mic.) or the presence (mic.+Aβ) of 20 μg/ml Aβ. B, Western blot detection of apoE in microglia cell extracts (5 μg of total protein, extract mic.) or in medium (4 μl per lane) recovered from 2 DIV pure microglia cultures (mic.), neuron–microglia cocultures (coc.), or 6 DIV pure neuronal cultures (neu.). Cultures were treated for 2 d with or without 2.5 mm AAA or 20 μg/ml Aβ.
Figure 6.
Figure 6.
Effects of apoE immunodepletion and supplementation on the survival of neurons exposed to Aβ. Four DIV neuronal cultures were treated for 2 d with MK801 (2.5 μm) and with or without Aβ (40 μg/ml), CM, or purified recombinant human apoE isoforms (80 nm). A, Effects of CM after immunodepletion of apoE (CMAPOE−) compared with CM after immunoprecipitation with unrelated antibodies (CMAPOE+). The effectiveness of the depletion is illustrated by Western detection of apoE in the conditioned medium before immunoprecipitation (CM), after depletion (CMAPOE−), and after treatment with nonrelevant antibodies (CMAPOE+). B, C, Effects of CMAPOE− supplemented with recombinant human apoE2 (E2), apoE3 (E3), or apoE4 (E4). C, Illustration of a control experiment verifying that variations in MAP2 O.D. in B correspond to changes in the number of MAP2-positive cells (see Materials and Methods). D, Effects of recombinant human apoE (E2, E3, or E4) added to unconditioned CDM. The MAP2 O.D. is expressed as the percentage of the mean value determined in untreated control (Ctrl.) neuronal cultures defined as 100%. Data are means ± SD from 5 or 10 determinations in sister wells from three (A, B), one (C), or four (D) independent experiments. The asterisk indicates significant difference between CMAPOE−-treated and CMAPOE+-treated neurons (A) or between Aβ-treated neurons and Aβ plus recombinant human apoE-treated neurons (B–D) (*p < 0.001 in A, B, and D; p < 0.05 in C; one-way ANOVA followed by Tukey–Kramer multiple comparisons test).
Figure 7.
Figure 7.
Anti-bFGF antibodies and lipid extractions with organic solvents do not prevent neuroprotection by CMAPOE− supplemented with human apoE2. Four DIV rat neuronal cultures were treated for 2 d with MK801 (2.5 μm) with or without Aβ (40 μg/ml) or CMAPOE- supplemented with apoE2 (80 nm). A, B, CDM and CMAPOE− were extracted three times with diethyl ether (A) or with n-hexane (B) before supplementation of CMAPOE- with human apoE2 and incorporation into 4 DIV cultures (see Materials and Methods). The MAP2 O.D. is expressed as the percentage of the mean value determined in untreated neuronal cultures defined as 100%. C, Anti-bFGF IgG (50 μg/ml) was added to 4 DIV cultures as indicated, and neuronal survival was quantified by counts of the number of MAP2-positive cells. Data are means ± SD from five determinations in sister wells from one (C) or two (A, B) independent experiments.
Figure 8.
Figure 8.
Effects of medium conditioned by apoE-KO mouse microglia on the survival of neurons exposed to Aβ. Four DIV rat neuronal cultures were treated for 2 d with MK801 (2.5 μm) with or without Aβ (40 μg/ml), CM recovered from wild-type (CM-wt) or apoE-KO (CM-apoE KO) mouse microglial cultures, or CM-apoE KO supplemented with human apoE isoforms (80 nm final). The MAP2 O.D. is expressed as the percentage of the mean value in control neuronal cultures. Data are means ± SD from five determinations in sister wells from two independent experiments. The asterisk indicates significant difference (*p < 0.001; one-way ANOVA followed by Tukey–Kramer multiple comparisons test).
Figure 9.
Figure 9.
Expression of xCT gene and microglial activation in the adult mouse hippocampus 7 d after injection of Aβ. A–D, Sagittal sections of the hippocampus of two animals injected with Aβ diluted in PBS (A, C) or PBS alone (B, D). Scale bar, 100 μm. A, B, ISH detection of xCT mRNA. CA3 and CA1 fields and the fimbria (fi) are indicated. C, D, Staining of microglia with peroxidase-conjugated isolectin B4. The microglial reaction and xCT mRNA are most prominent in the ventral part of CA3 after Aβ injection. E, Colocalization of injected Aβ (Congo red staining) and xCT mRNA (ISH, blue) in the ventral part of CA3. Scale bar, 100 μm. F, ISH detection of xCT mRNA (blue) in reactive microglial cells stained with peroxidase-conjugated–isolectin B4. Scale bar, 20 μm. G, H, Region lining the needle track in an animal injected with PBS. G, Staining with peroxidase-conjugated–isolectin B4. H, ISH detection of xCT mRNA. Scale bars, 50 μm.
Figure 10.
Figure 10.
Detection of xCT mRNA, amyloid plaques, and activated microglia in the cerebral cortex of a 15-month-old TgAPP mouse. A–C, Representative fields of the cerebral cortex from a TgAPP mouse. A, ISH detection of xCT mRNA. B, Congo red staining of amyloid plaques. C, Microglia stained with an anti-CD11b antibody (brown peroxidase staining). Inset, Double detection of xCT mRNA (ISH, blue) and reactive microglial cells (anti-CD11b, brown). D, Representative field of the cerebral cortex from an age-matched wild-type mouse: ISH does not detect xCT mRNA. Scale bars: A–D, 100 μm; inset, 10 μm.

Similar articles

Cited by

References

    1. Bales KR, Verina T, Cummins DJ, Du Y, Dodel RC, Saura J, Fishman CE, DeLong CA, Piccardo P, Petegnief V, Ghetti B, Paul SM (1999). Apolipoprotein E is essential for amyloid deposition in the APP(V717F) transgenic mouse model of Alzheimer's disease. Proc Natl Acad Sci USA 96:15233–15238. - PMC - PubMed
    1. Bannai S, Sato H, Ishii T, Sugita Y (1989). Induction of cystine transport activity in human fibroblasts by oxygen. J Biol Chem 264:18480–18484. - PubMed
    1. Barger SW, Basile AS (2001). Activation of microglia by secreted amyloid precursor protein evokes release of glutamate by cystine exchange and attenuates synaptic function. J Neurochem 76:846–854. - PubMed
    1. Beutler HO (1985). l-Glutamate, colorimetric method with glutamate dehydrogenase and diaphorase. In: Methods of enzymatic analysis (Grassl M, ed.) pp. 369–376. Weinheim, Germany: VCH Verlagsgesellschaft mbH.
    1. Blanchard V, Moussaoui S, Czech C, Touchet N, Bonici B, Planche M, Canton T, Jedidi I, Gohin M, Wirths O, Bayer TA, Langui D, Duyckaerts C, Tremp G, Pradier L (2003). Time sequence of maturation of dystrophic neurites associated with Abeta deposits in APP/PS1 transgenic mice. Exp Neurol 184:247–263. - PubMed

Publication types

MeSH terms