. 2006 Jun;95(6):3948-54.
doi: 10.1152/jn.01378.2005. Epub 2006 Mar 22.

Interneuron and pyramidal cell interplay during in vitro seizure-like events

Affiliations

Interneuron and pyramidal cell interplay during in vitro seizure-like events

Jokubas Ziburkus et al. J Neurophysiol. 2006 Jun.

Erratum in

  • J Neurophysiol. 2006 Aug;96(2):965

Abstract

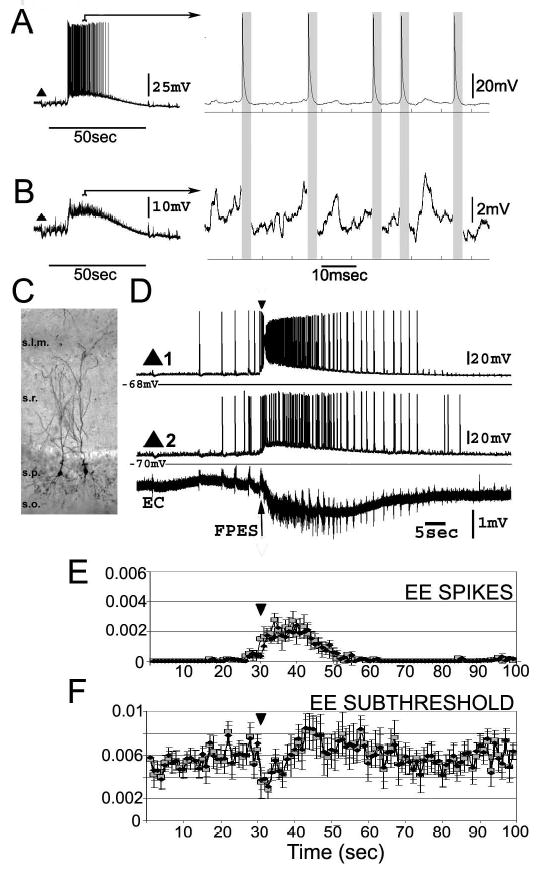
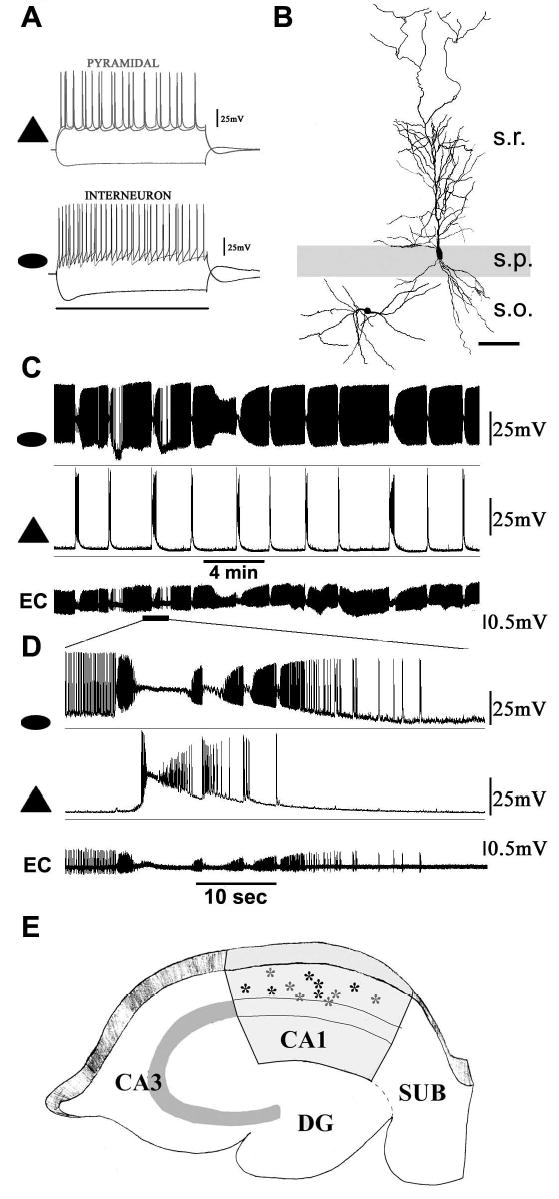
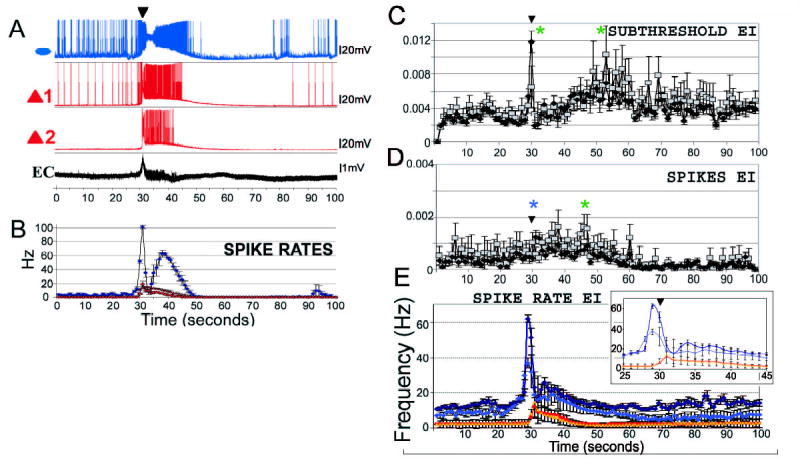
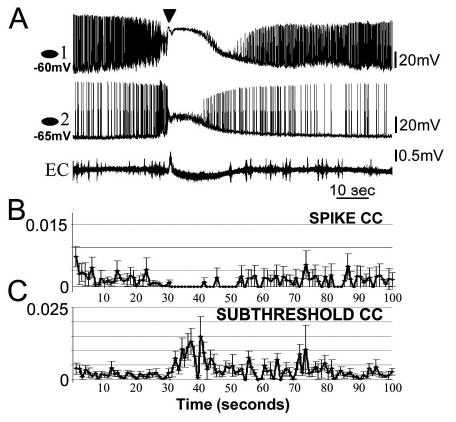
Excitatory and inhibitory (EI) interactions shape network activity. However, little is known about the EI interactions in pathological conditions such as epilepsy. To investigate EI interactions during seizure-like events (SLEs), we performed simultaneous dual and triple whole cell and extracellular recordings in pyramidal cells and oriens interneurons in rat hippocampal CA1. We describe a novel pattern of interleaving EI activity during spontaneous in vitro SLEs generated by the potassium channel blocker 4-aminopyridine in the presence of decreased magnesium. Interneuron activity was increased during interictal periods. During ictal discharges interneurons entered into long-lasting depolarization block (DB) with suppression of spike generation; simultaneously, pyramidal cells produced spike trains with increased frequency (6-14 Hz) and correlation. After this period of runaway excitation, interneuron postictal spiking resumed and pyramidal cells became progressively quiescent. We performed correlation measures of cell-pair interactions using either the spikes alone or the subthreshold postsynaptic interspike signals. EE spike correlation was notably increased during interneuron DB, whereas subthreshold EE correlation decreased. EI spike correlations increased at the end of SLEs, whereas II subthreshold correlations increased during DB. Our findings underscore the importance of complex cell-type-specific neuronal interactions in the formation of seizure patterns.


Figures

Figure 1
Figure 1. Analysis of the SLEs in pyramidal cell pairs
A. Left trace shows the complete voltage signal recorded from a pyramidal cell during SLE; right contains an expanded excerpt from the left. B. Examples of the same signal as in A with the spikes removed (regions in gray boxes). The residual interspike voltage signal was used for subthreshold correlation analysis. C. Photomicrograph of two neurobiotin filled pyramidal cells in the CA1. s. - stratum; l.m. - lacunosum moleculare; r. - radiatum; p. -pyramidale; o. - oriens. D. Whole-cell recordings from two pyramidal cells (triangles) and an extracellular electrode (EC). Following some pre-ictal spikes, pyramidal cells fire a prolonged burst of spikes riding on a wave of intracellular depolarization (ictal event), followed by post-ictal spikes of decaying frequency. The inverted triangle (30sec., D and E) is aligned with the FPESs used to denote the start of the ictal events. E. The crosscorrelation between each pair was measured within one-second nonoverlapping windows beginning 30 seconds before until 70 seconds after the FPES. Graphs of crosscorrelation values for spikes (top) and subthreshold voltages (bottom). Black diamonds represent unweighted pooled and gray squares weighted resampled averages. ANOVA results for one-second windows showed that crosscorrelation values for subthreshold voltages (df=7199, F=1.38, p=0.0083 for unweighted) and for the spikes (df=7199, F=14.72, p<0.0001) significantly changed across the evolution of SLEs. Tukey multiple comparison tests (p<0.001 for unweighted and p<0.05 for weighted averages) confirmed that correlation values at the start of the ictal event (inverted triangle mark) significantly decreased for the subthreshold voltages and increased for the spikes.
Figure 2
Figure 2. EI interplay during SLEs
A. Examples of pyramidal (triangle) and oriens interneuron (ellipse) membrane properties following 500 msec (scale bar) negative and positive current injections. B. Camera lucida microscope drawings of the dendrites of the cells in A. s. - stratum; o. - oriens; p - pyramidale; r - radiatum. Scale bar - 50μm. C. Repetitive SLEs and EI interplay. The interneuron (ellipse) is more active in 4-AP than the pyramidal (triangle) cell. EC denotes a fortuitous extracellular single unit recording of action potentials from the axon of this interneuron. The EC electrode was placed in oriens, about 75μm from the interneuron soma. D. Expanded time base illustrating robust EI interplay during the SLEs. Note the cessation of axonal spikes in EC during interneuron DB. E. Locations of interneurons exhibiting DB. Horizontal and rounded interneuron somata were mapped following neurobiotin histochemistry. Gray stars indicate interneurons that underwent DB in isolated CA1.
Figure 3
Figure 3. EI interplay during SLEs
A. Traces from simultaneous whole-cell measurements from one interneuron (blue, ellipse) and two pyramidal cells (red, triangles), and an extracellular DC mode recording (EC). Inverted black triangles denote the FPESs. B. Average spike rates of the three cells (interneuron - blue circles, pyramidal 1 - red diamonds, pyramidal 2 - red triangles). Note that the plot in B is an average (n=8 SLEs in the experiment), and hence is not precisely time locked to the single SLE example shown in A. C. EI crosscorrelation averages. The means of EI subthreshold crosscorrelation values were significantly different (ANOVA: df=10199, F=4.27, p<0.0001) at distinct SLE stages (Tukey multicomparison, green asterisks). Unweighted pooled subthreshold EI crosscorrelation values (represented as black diamonds) peaked at the onset of SLEs, followed by a decrease, and then a gradual increase towards the end of the SLEs (Tukey multiple comparison test, p<0.001). With weighted resampled averages (gray squares) the peak at the onset of SLEs was less prominent, but the significance of the increase in subthreshold EI correlations was retained (p<0.05). Inverted black triangles denote the FPESs in C, D, inset in E. D. A significant increase in EI spike correlations was observed at the beginning (unweighted, blue asterisk) and following the DB in interneurons (weighted averages, green asterisk). (ANOVA, df=10199, F=3.27, p<0.0001; Tukey multiple comparison test, p<0.001 for unweighted (black diamonds) and p<0.005 for weighted resampled (gray squares) averages). E. Cumulative average spike rates (n=15 oriens interneurons and n=40 pyramidal cells from pairs and single whole cell recordings). Note the peak of inhibitory spiking preceding the FPES (dark blue – I unweigthed pooled; light blue – I weighted resampled). Excitatory firing rates increase as interneurons enter into the DB and decreased as interneurons exit the DB (red – E unweigthed pooled; orange - unweigthed pooled). Inset shows average spike rates at expanded time scale.
Figure 4
Figure 4. II activity during SLEs
A. Whole cell measurements from two oriens interneurons accompanied by the average cross correlation (CC) measures of suprathreshold (B) and sub-threshold (C) signals (n=13 SLEs, 3 pairs). Inverted triangle indicates the FPES. Note the clear loss of spiking and increase in subthreshold correlations during DB in II pairs (unweighted averages).

References

    1. Aradi I, Maccaferri G. Cell type-specific synaptic dynamics of synchronized bursting in the juvenile CA3 rat hippocampus. J Neurosci. 2004;24:9681–92. - PMC - PubMed
    1. Avoli M, Barbarosie M, Lucke A, Nagao T, Lopantsev V, Kohling R. Synchronous GABA-mediated potentials and epileptiform discharges in the rat limbic system. J Neurosci. 1996a;16:3912–3924. - PMC - PubMed
    1. Avoli M, Louvel J, Kurcewicz I, Pumain R, Barbarosie M. Extracellular free potassium and calcium during synchronous activity induced by 4-aminopyridine in the juvenile rat hippocampus. J Physiol. 1996b;493:707–717. - PMC - PubMed
    1. Avoli M, Perreault P, Olivier A, Villemure JG. 4-Aminopyridine induces a long-lasting depolarizing GABA-ergic potential in human neocortical and hippocampal neurons maintained. Neurosci Lett. 1988;943:27–332. - PubMed
    1. Babb TL, Pretorius JK, Kupfer WR, Crandall PH. Glutamate decarboxylase immunoreactive neurons are preserved in human epileptic hippocampus. J Neurosci. 1989;7:2562–2574. - PMC - PubMed

Publication types