. 2006 Mar 22;34(5):1512-21.
doi: 10.1093/nar/gkl027. Print 2006.

LINE-1 RNA splicing and influences on mammalian gene expression

Affiliations

LINE-1 RNA splicing and influences on mammalian gene expression

Victoria P Belancio et al. Nucleic Acids Res. .

Abstract

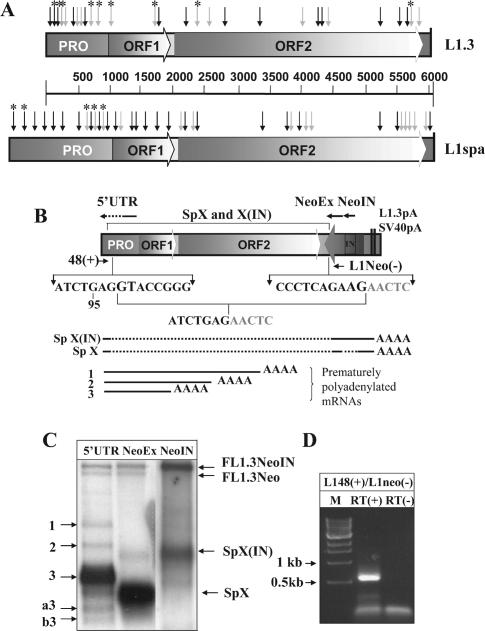
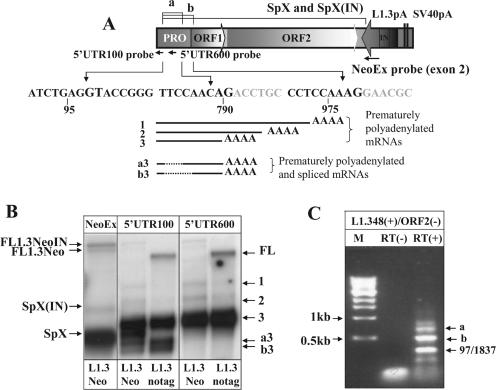
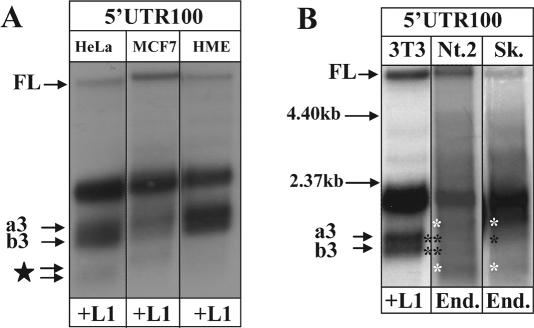
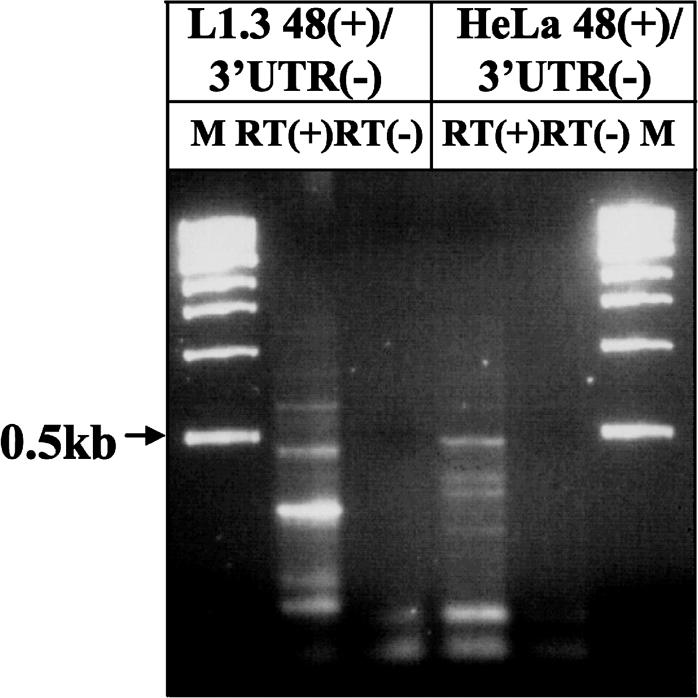
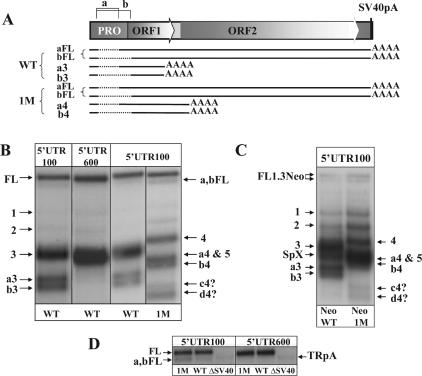
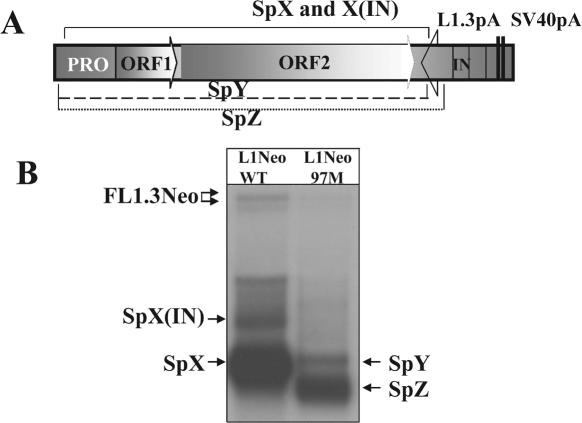
Long interspersed element-1 elements compose on average one-fifth of mammalian genomes. The expression and retrotransposition of L1 is restricted by a number of cellular mechanisms in order to limit their damage in both germ-line and somatic cells. L1 transcription is largely suppressed in most tissues, but L1 mRNA and/or proteins are still detectable in testes, a number of specific somatic cell types, and malignancies. Down-regulation of L1 expression via premature polyadenylation has been found to be a secondary mechanism of limiting L1 expression. We demonstrate that mammalian L1 elements contain numerous functional splice donor and acceptor sites. Efficient usage of some of these sites results in extensive and complex splicing of L1. Several splice variants of both the human and mouse L1 elements undergo retrotransposition. Some of the spliced L1 mRNAs can potentially contribute to expression of open reading frame 2-related products and therefore have implications for the mobility of SINEs even if they are incompetent for L1 retrotransposition. Analysis of the human EST database revealed that L1 elements also participate in splicing events with other genes. Such contribution of functional splice sites by L1 may result in disruption of normal gene expression or formation of alternative mRNA transcripts.


Figures

Figure 1
Figure 1
LINE-1 elements contain multiple splice sites. (A) A schematic representation of putative splice sites identified by the BDGP program in the sense strand of human L1.3 and mouse L1spa. Black (SD) and gray (SA) arrows mark splice sites using a default cutoff value of 0.4. Asterisks mark SD and SA sites that have been identified as functional based upon sequence analysis of spliced transcripts recovered by RT–PCR or as determined by sequence analysis of spliced products found re-integrated into the human and mouse genomes. PRO corresponds to the L1 promoter region, ORF1 and ORF2 identify ORFs 1 and 2. (B) A schematic representation of the L1.3 neomycin-resistance (L1.3Neo) expression cassette. The position and orientation of the NeoR gene are shown by an arrow. It is interrupted by an intron (IN) in the same orientation as the L1 ORFs. The cassette ends in L1.3 and SV40 polyadenylation signals (L1.3pA and SV40pA, respectively). The L1.3 portion that is missing in transcripts SpX and X(IN) is marked above the cassette. Sequences below the schematic of the vector demonstrate the 5′ and 3′ splice sites with invariant GT and AG dinucleotides shown in larger font. The resulting sequence of the splicing event is listed under the junctions. Arrows above the L1.3 expression cassette (marked 5′-UTR, NeoEx and NeoIN) represent positions of the strand-specific RNA probes used for L1 RNA detection. The arrows indicate the sense of the probes. Because of the length of the 5′-UTR probe (900 bp) in vitro transcription products are a mix of truncated transcripts, which are enriched for the 3′ end of the L1.3 5′-UTR (solid portion of the arrow). Below the sequences is a schematic representation of the splice products generated between the L1.3 and the Neo cassette [SpX(IN) and SpX] and the premature polyadenylated, unspliced L1.3 mRNAs (–3). Solid black lines represent portions of the L1.3 and Neo cassette sequences included in the transcripts. Dotted lines denote parts that were removed by splicing. (C) Northern blot analysis of poly(A)-selected mRNAs from NIH 3T3 cells transfected with the L1.3Neo expression vector. Strand-specific probes corresponding to the L1.3 5′-UTR (5′UTR), second exon of the NeoR gene (NeoEx) and intron of the NeoR gene (NeoIN) were designed to detect plus-strand mRNAs. Full-length L1.3Neo mRNAs with spliced and unspliced NeoR introns are marked as FL1.3Neo and FL1.3NeoIN, respectively. Numbers 1 through 3 indicate products of premature polyadenylation (17). Potential splice species are labeled as SpX, SpX(IN), ‘a3’ and ‘b3’ [‘a’ and ‘b’ denotes splicing events (Figure 2) and a number corresponds to the poly(A) sites used to generate the 3′ end of the transcripts]. Note that the most abundant band in the NeoEx lane is barely detected with the 5′-UTR probe (5′UTR lane) indicating that it contains a small portion of L1.3. In vitro-generated 5′-UTR probe is not all full-length and therefore the detection is skewed toward the 3′ end of the 5′-UTR. Results of blotting with the strand-specific probe to the NeoR intron (NeoIN) indicate that SpX(IN) contains the intron while SpX does not. (D) RT–PCR analysis of the L1/NeoR splice junction. Positions of 48(+) and L1Neo(−) primers are shown in (B). RT(+) and (−) indicate the presence or absence of RT in the respective RT–PCRs.
Figure 2
Figure 2
L1.3 mRNA undergoes splicing at multiple sites. (A) L1.3Neo splicing. The portions of the L1.3 that are removed in splice products ‘a’ and ‘b’ are annotated above the cartoon of the expression cassette with splice site sequences listed underneath. Strand-specific 100 bp probes corresponding to positions 1–100 (5′UTR100) and 583–698 (5′UTR600) of the L1.3 sequence are shown under the promoter (Pro) portion of the L1.3 with the arrow denoting the sense of the probes. Strand-specific NeoEx probe is the same as in Figure 1. Underneath the sequences is a schematic representation of the prematurely polyadenylated L1 mRNAs [1–3, that are detected with both 5′UTR100 and 5′UTR600 probes in (B)] and prematurely polyadenylated and spliced transcripts [a3 and b3, that are detectable only with the 5′UTR100 probe in (B)]. Solid black lines represent parts of L1.3 sequence included in the transcripts. Dotted black lines correspond to the L1.3 sequences removed by splicing. SpX(IN) and SpX products are the same as in Figure 1. (B) Northern blot analysis of poly(A)-selected mRNAs from NIH 3T3 cells transfected with vectors expressing either L1.3Neo (L1Neo) or only L1.3 sequences (L1.3-notag). The 5′UTR100 strand-specific probe detected premature poly(A) products (bands 1 through 3), as well as the splice products SpX in the L1.3Neo RNA and the ‘a3’ and ‘b3’ products for the L1.3Neo and L1.3-notag constructs [where ‘a’ refers to the splice and 3 to the poly(A) site used to create the transcript]. The SpX, ‘a3’ and ‘b3’ bands were not detected by a strand-specific 5′UTR600 probe complementary to the portion of L1.3 expected to be spliced from these transcripts. FL annotates the full-length L1.3 mRNA. (C) RT–PCR analysis of poly(A)-selected mRNAs from NIH 3T3 cells transiently transfected with L1.3 expression cassette. The 48(+) forward primer described in Figure 1B and ORF2(−) reverse primer located in L1 ORF2 were used. Note that ORF2 primer can also anneal at position 1359 of L1.3 sequence therefore products of splices ‘a’ and ‘b’ are smaller than expected when the primer anneals at the position 2038 in ORF2 of L1.3.
Figure 3
Figure 3
Transiently transfected and endogenously expressed L1s undergo splicing in human cells. (A) Northern blot analyses of RNA species produced by the L1.3-notag expression cassette transiently transfected in HeLa, MCF7 and HME cells. Poly(A)-selected total mRNAs from the cell lines were detected with the strand-specific RNA probe complementary to the first 100 bp of the L1.3 5′UTR (5′UTR100). FL corresponds to the full-length L1.3 element, a3 and b3 and c4 and b4 indicate spliced and prematurely polyadenylated products. Note that spliced mRNAs are detected in both normal (HME) and cancer cells transfected with L1.3 expression cassette. The star denotes bands with an uncharacterized combination of splicing and polyadenylation. (B) Northern blot analyses of RNA species produced by the L1.3-notag expression cassette transiently transfected in NIH 3T3 cells (Lane 3T3/+L1) or endogenously expressed human L1s from Ntera2 (Nt.2/End.) and Sk-Br-3 (Sk/End.) cells. Poly(A)-selected total mRNAs from the cell lines were detected with the strand-specific RNA probe complementary to the first 100 bp of the L1.3 5′UTR (5′UTR100). FL corresponds to the full-length L1.3 element detected in NIH 3T3 cells or to the endogenous L1s detected in human cell lines. a3 and b3 indicate spliced and prematurely polyadenylated products. Black asterisks mark truncated mRNA products in human cells exhibiting similar migration patterns to the spliced mRNAs identified in NIH 3T3 cells. White asterisks point out truncated mRNA products in Ntera2 and Sk-Br-3 cells that are not detected in transiently transfected mouse cells. Black horizontal arrows correspond to the position of the size markers.
Figure 4
Figure 4
Endogenous L1 elements expressed in HeLa cells undergo splicing. RT–PCR analysis of poly(A)-selected RNAs from HeLa cells and L1-notag transfected NIH 3T3 cells was carried out with 48(+) upstream primer and 3′-UTR(−) downstream primer located in the L1.3 3′-UTR. RT(+) and (−) indicate reactions with and without reverse transcriptase.
Figure 5
Figure 5
The relationship between polyadenylation and splicing of L1 transcripts. (A) A diagram of the L1.3-notag construct. Diagrams of the major splice variants detected by northern blot analysis of the wild type (WT) and mutant of the strongest poly(A) site (1M) L1.3 elements are shown underneath the construct. Solid black lines represent L1.3 sequences included into RNA transcripts. Dotted lines represent regions of L1.3 sequence removed by splicing. Some ‘a’ and ‘b’ splicing events may use poly(A) sites at the end of the L1 genome (a,bFL in WT and 1M elements), while others may prematurely terminate at the internal L1 poly(A) signals (‘a3’ and ‘b3’ in the WT and ‘a4’ and ‘b4’ in the 1M L1.3). (B) Northern blot analysis of the WT and 1M L1.3-notag constructs transiently transfected in NIH 3T3 cells with 5′UTR100 and 5′UTR600 strand-specific probes. Full-length L1.3 mRNA and spliced L1.3 mRNA terminated at the end of the L1 genome are marked as FL and a,bFL, respectively. Spliced and prematurely truncated mRNAs are marked as ‘a3’, ‘b3’, a4, b4. The star denotes bands with an as yet uncharacterized combination of splicing and polyadenylation that arise in the 1M mutant. (C) Northern blot analysis of the WT and 1M L1.3Neo constructs transiently transfected in NIH 3T3 cells with 5′UTR100 strand-specific probe. Full-length L1.3Neo mRNA is labeled FL1.3Neo. The splice variant specific to this vector is shown as SpX. Spliced and prematurely truncated mRNAs are identified as described in (B). (D) Northern blot analysis of the full-length and faster-migrating L1.3 mRNAs produced by the WT, 1M and ΔSV40 (L1.3 with no pA site at the end of the element) L1.3 constructs with 5′UTR100 and 5′UTR600 strand-specific probes. TRpA stands for the truncated polyadenylated L1.3 mRNA. Other products are marked as described above.
Figure 6
Figure 6
Mutation of one of the splice sites in the L1.3 sequence results in the more efficient utilization of another splice signal. (A) An illustration of the major splicing events between either wt L1.3 [marked SpX and X(IN)] or a mutant of the 97 SD site, 97M, (marked SpY and Z) and the NeoR gene produced by the L1Neo construct. The dotted lines labeled SpY and SpZ represent predicted splices corresponding to those bands in the northern blot. (B) A northern blot analysis of the above depicted constructs with the NeoEx strand-specific probe.

References

    1. Lander E.S., Linton L.M., Birren B., Nusbaum C., Zody M.C., Baldwin J., Devon K., Dewar K., Doyle M., FitzHugh W., et al. Initial sequencing and analysis of the human genome. Nature. 2001;409:860–921. - PubMed
    1. Waterston R.H., Lindblad-Toh K., Birney E., Rogers J., Abril J.F., Agarwal P., Agarwala R., Ainscough R., Alexandersson M., An P., et al. Initial sequencing and comparative analysis of the mouse genome. Nature. 2002;420:520–562. - PubMed
    1. Medstrand P., van de Lagemaat L.N., Mager D.L. Retroelement distributions in the human genome: variations associated with age and proximity to genes. Genome Res. 2002;12:1483–1495. - PMC - PubMed
    1. Smit A.F. Interspersed repeats and other mementos of transposable elements in mammalian genomes. Curr. Opin. Genet Dev. 1999;9:657–663. - PubMed
    1. Murphy L.C., Dotzlaw H., Hamerton J., Schwarz J. Investigation of the origin of variant, truncated estrogen receptor-like mRNAs identified in some human breast cancer biopsy samples. Breast Cancer Res. Treat. 1993;26:149–161. - PubMed

Publication types