

Dissociation energetics and mechanisms of leucine enkephalin (M + H)+ and (2M + X)+ ions (X = H, Li, Na, K, and Rb) measured by blackbody infrared radiative dissociation
- PMID: 16554908
- PMCID: PMC1409762
- DOI: 10.1016/S1044-0305(97)84129-3
Dissociation energetics and mechanisms of leucine enkephalin (M + H)+ and (2M + X)+ ions (X = H, Li, Na, K, and Rb) measured by blackbody infrared radiative dissociation
Abstract
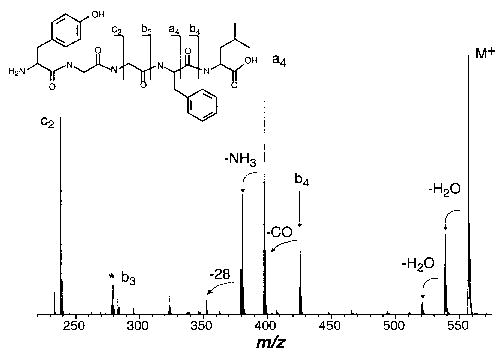
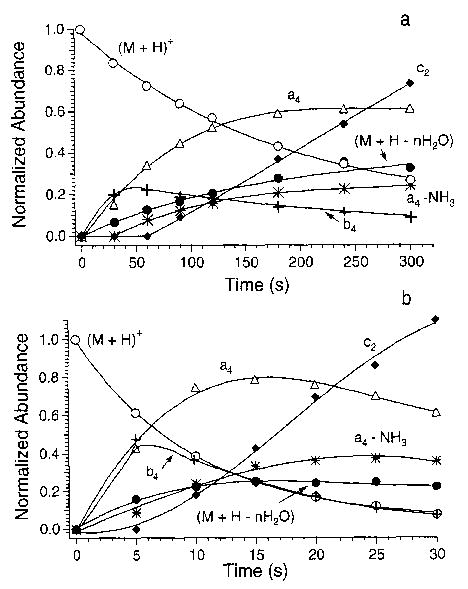
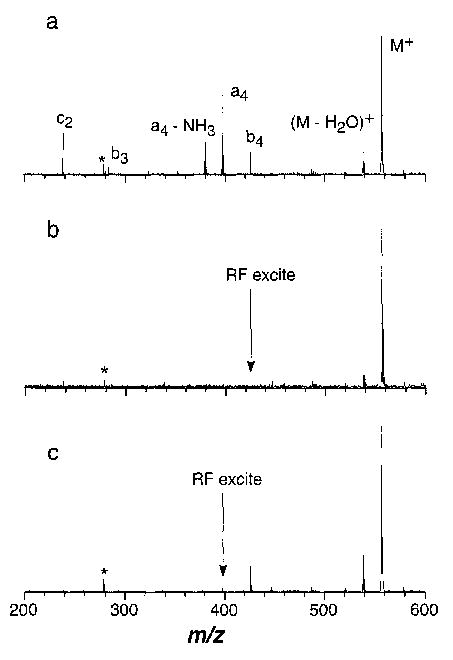
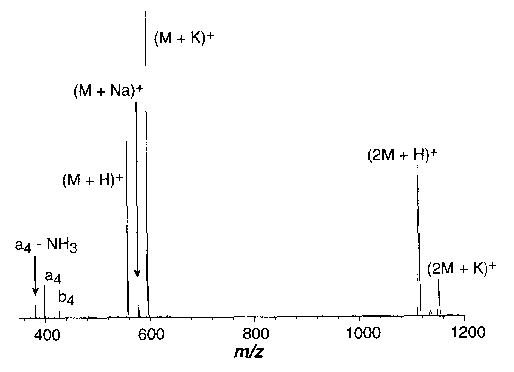
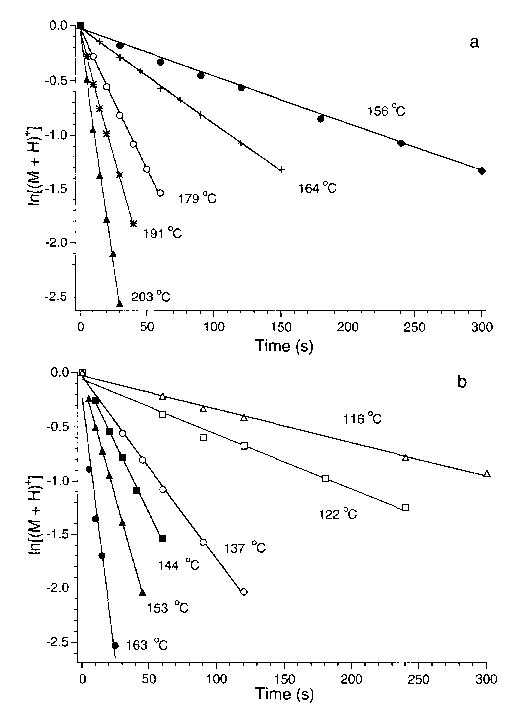
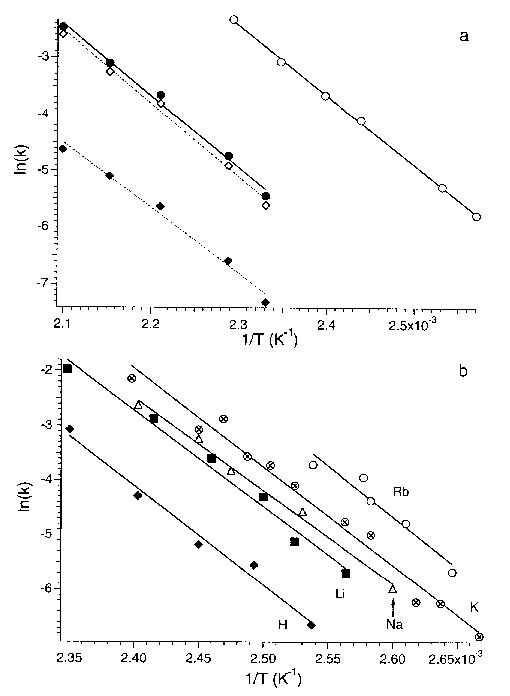
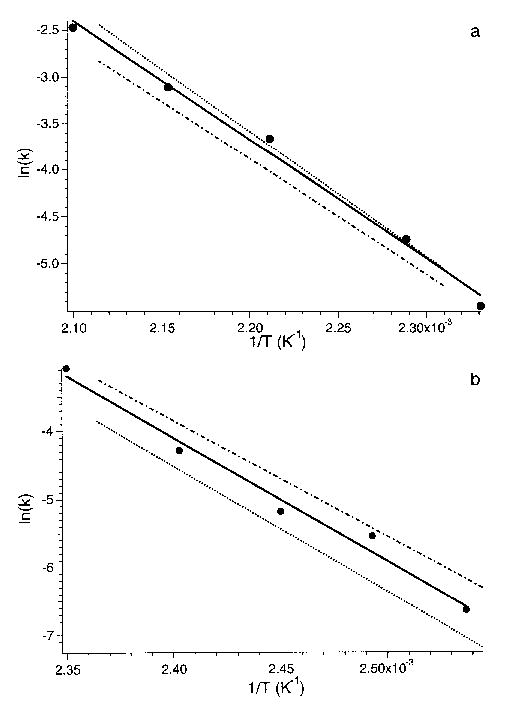
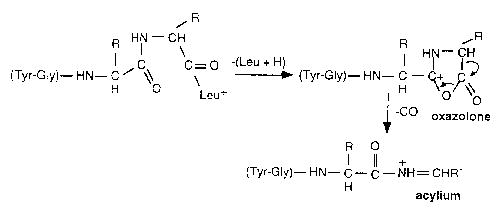
The dissociation kinetics of protonated leucine enkephalin and its proton and alkali metal bound dimers were investigated by blackbody infrared radiative dissociation in a Fourier-transform mass spectrometer. From the temperature dependence of the unimolecular dissociation rate constants, Arrhenius activation parameters in the zero-pressure limit are obtained. Protonated leucine enkephalin dissociates to form b(4) and (M-H(2)O)(+) ions with an average activation energy (E(a)) of 1.1 eV and an A factor of 10(10.5) s(-1). The value of the A factor indicates that these dissociation processes are rearrangements. The b(4) ions subsequently dissociate to form a(4) ions via a process with a relatively high activation energy (1.3 eV), but one that is entropically favored. For the cationized dimers, the thermal stability decreases with increasing cation size, consistent with a simple electrostatic interaction in these noncovalent ion-molecule complexes. The E(a) and A factors are indistinguishable within experimental error with values of approximately 1.5 eV and 10(17) s(-1), respectively. Although not conclusive, results from master equation modeling indicate that all these BIRD processes, except for b(4) --> a(4), are in the rapid energy exchange limit. In this limit, the internal energy of the precursor ion population is given by a Boltzmann distribution and information about the energetics and dynamics of the reaction are obtained directly from the measured Arrhenius parameters.
Figures

Similar articles
-
Activation of Peptide ions by blackbody radiation: factors that lead to dissociation kinetics in the rapid energy exchange limit.J Phys Chem A. 1997 Nov 20;101(47):8844-52. doi: 10.1021/jp9722418. J Phys Chem A. 1997. PMID: 16604162 Free PMC article.
-
Blackbody infrared radiative dissociation of bradykinin and its analogues: energetics, dynamics, and evidence for salt-bridge structures in the gas phase.J Am Chem Soc. 1996 Jul 31;118(30):7178-89. doi: 10.1021/ja9609157. J Am Chem Soc. 1996. PMID: 16525512 Free PMC article.
-
Effects of charge state on fragmentation pathways, dynamics, and activation energies of ubiquitin ions measured by blackbody infrared radiative dissociation.Anal Chem. 1997 Mar 15;69(6):1119-26. doi: 10.1021/ac960804q. Anal Chem. 1997. PMID: 9075403 Free PMC article.
-
Leucine enkephalin--a mass spectrometry standard.Mass Spectrom Rev. 2011 Mar-Apr;30(2):298-320. doi: 10.1002/mas.20279. Epub 2010 Jul 28. Mass Spectrom Rev. 2011. PMID: 20669325 Review.
-
Collisional activation of peptide ions in FT-ICR mass spectrometry.Mass Spectrom Rev. 2003 May-Jun;22(3):158-81. doi: 10.1002/mas.10041. Mass Spectrom Rev. 2003. PMID: 12838543 Review.
Cited by
-
Collisional activation of ions in RF ion traps and ion guides: the effective ion temperature treatment.J Am Soc Mass Spectrom. 2004 Nov;15(11):1616-28. doi: 10.1016/j.jasms.2004.07.014. J Am Soc Mass Spectrom. 2004. PMID: 15519229
-
A comparative study of in- and post-source decays of peptide and preformed ions in matrix-assisted laser desorption ionization time-of-flight mass spectrometry: effective temperature and matrix effect.J Am Soc Mass Spectrom. 2010 Nov;21(11):1876-83. doi: 10.1016/j.jasms.2010.07.001. Epub 2010 Aug 7. J Am Soc Mass Spectrom. 2010. PMID: 20696595
-
Determination of the activation energy for unimolecular dissociation of a non-covalent gas-phase peptide: substrate complex by infrared multiphoton dissociation fourier transform ion cyclotron resonance mass spectrometry.J Am Soc Mass Spectrom. 2003 Nov;14(11):1282-9. doi: 10.1016/S1044-0305(03)00576-2. J Am Soc Mass Spectrom. 2003. PMID: 14597118
-
Formation of hydrated triply charged metal ions from aqueous solutions using nanodrop mass spectrometry.Int J Mass Spectrom. 2006 Jul 1;253(3):256-262. doi: 10.1016/j.ijms.2006.04.009. Int J Mass Spectrom. 2006. PMID: 19081753 Free PMC article.
-
Investigation of Hemicryptophane Host-Guest Binding Energies Using High-Pressure Collision-Induced Dissociation in Combination with RRKM Modeling.J Am Soc Mass Spectrom. 2019 Mar;30(3):509-518. doi: 10.1007/s13361-018-2109-5. Epub 2018 Nov 26. J Am Soc Mass Spectrom. 2019. PMID: 30478817
References
-
- McLafferty, F. W. Tandem Mass Spectrometry, Wiley: New York, 1983. - PubMed
-
- Busch, K. L.; Glish, G. L.; McLuckey, S. A. Mass Spectrometry/Mass Spectrometry: Techniques and Applications of Tandem Mass Spectrometry; VCH: New York, 1988.
-
- Dongre AR, Somogyi A, Wysocki VHJ. Mass Spectrom. 1996;31:339–350. - PubMed
Grants and funding
LinkOut - more resources
Full Text Sources
Other Literature Sources
