Comparative Study
. 2006 May-Jun;8(3):163-70.
doi: 10.1007/s11307-006-0038-3.

Noninvasive evaluation of immunosuppressive drug efficacy on acute donor cell survival

Affiliations
Comparative Study

Noninvasive evaluation of immunosuppressive drug efficacy on acute donor cell survival

Olivier Gheysens et al. Mol Imaging Biol. 2006 May-Jun.

Abstract

Purpose: The therapeutic benefits of cell transplantation may depend on the survival of sufficient numbers of grafted cells. We evaluate four potent immunosuppressive medications aimed at preventing acute donor cell death.

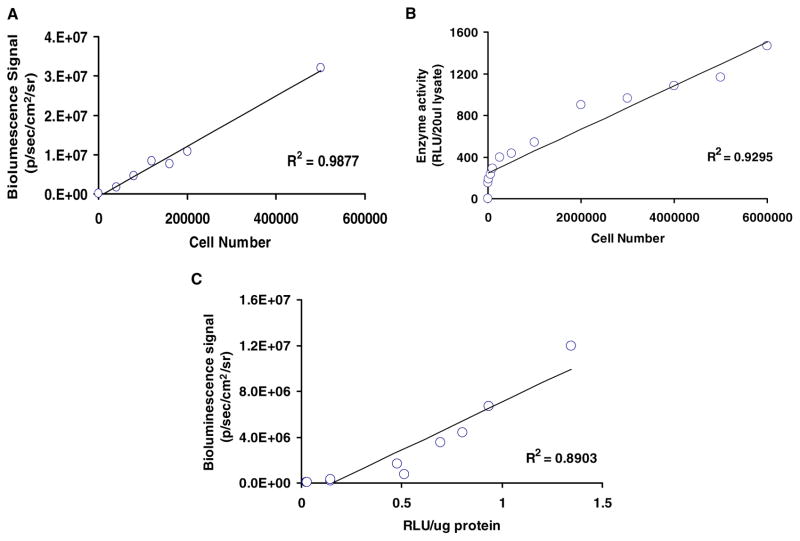
Procedures and results: Embryonic rat H9c2 myoblasts were stably transduced to express firefly luciferase reporter gene (H9c2-Fluc). H9c2-Fluc cells (3x10(6)) were injected into thigh muscles of Sprague-Dawley rats (N=30) treated with cyclosporine, dexamethasone, mycophenolate mofetil, tacrolimus, or saline from day -3 to day +14. Longitudinal optical bioluminescence imaging was performed over two weeks. Fluc activity was 40.0+/-12.1% (dexamethasone), 30.5+/-12.5% (tacrolimus), and 21.5+/-3.5% (mycophenolate) vs. 12.0+/-5.0% (control) and 8.3+/-5.0% (cyclosporine) at day 4 (P<0.05). However, by day 14, cell signals had decreased drastically to <10% for all groups despite drug therapy.

Conclusion: This study demonstrates the ability of optical molecular imaging for tracking cell survival noninvasively and raises important questions with regard to the overall efficacy of immunosuppressives for prolonging transplanted cell survival.


Figures

Fig. 1
Fig. 1
Comparison of morphology and proliferation between control H9c2 and H9c2-Fluc cells. (A) Fusion of bright-field (grayscale) and immunofluorescent (color) images reveals that both control H9c2 and H9c2-Fluc cells have similar gross morphology and pattern of nuclear (purple) and cytoplasmic smooth muscle α-actin (red) staining. (B) Furthermore, both cell lines have comparable growth rate, as indicated by their optical density (OD) at 24, 48, and 72 hours post plating.
Fig. 2
Fig. 2
Confirmation of firefly luciferase expression in H9c2 cells. (A) RT–PCR of control H9c2 and H9c2-fluc cells reveals a 395-bp band (right lane), corresponding to the reversely transcribed firefly luciferase mRNA in H9c2-fluc cells, and no corresponding band for the H9c2 cells (left lane). (B) Western blotting reveals a 62 kDa band corresponding to the size of firefly luciferase in H9c2-Fluc (left lane) but not in H9c2 cells (right lane). (C) In vitro bioluminescence imaging reveals firefly luciferase-mediated signals only in H9c2-Fluc cells (bottom well) and not in control H9c2 cells (top well).
Fig. 3
Fig. 3
Differential effect of immunosuppressive medications on posttransplantation cell survival. (A) Representative bioluminescence images of animals treated with saline (control), mycophenolate, tacrolimus, and a combination of tacrolimus, dexamethasone, and mycophenolate. Notably, animals treated with the combination regimen have longer detectable signal (14 days) compared to other treatment groups. (B) The survival kinetics of the drug treatment groups show similar trends in that cell signal declines significantly (> 35%) on day 2 or 3 and falls to negligible levels by the end of second week. In contrast, the cell signal is no longer visible as early as the first week for the control group. Statistical significance compared to control is indicated at two ranges of P values: #P < 0.05 and *P < 0.01.
Fig. 4
Fig. 4
Quantification of cell number using bioluminescence imaging. (A) H9c2-Fluc cells plated at different densities yield linearly proportional and highly correlated (r2 = 0.98) bioluminescence signals after D-luciferin substrate exposure. (B) The level of in vitro firefly luciferase enzyme activity correlates linearly with cell number. (C) A strong correlation exists between in vivo cell-mediated bioluminescence signal and in vitro firefly luciferase enzyme activity, attesting to the feasibility of using bioluminescence imaging to monitor cells noninvasively.

References

    1. Goldman S. Stem and progenitor cell-based therapy of the human central nervous system. Nat Biotechnol. 2005;23:862–871. - PubMed
    1. Chien KR, Karsenty G. Longevity and lineages: Toward the integrative biology of degenerative diseases in heart, muscle, and bone. Cell. 2005;120:533–544. - PubMed
    1. Bonner-Weir S, Weir GC. New sources of pancreatic beta-cells. Nat Biotechnol. 2005;23:857–861. - PubMed
    1. Hofmann M, Wollert KC, Meyer GP, et al. Monitoring of bone marrow cell homing into the infarcted human myocardium. Circulation. 2005;111:2198–2202. - PubMed
    1. Bulte JW, Douglas T, Witwer B, et al. Magnetodendrimers allow endosomal magnetic labeling and in vivo tracking of stem cells. Nat Biotechnol. 2001;19:1141–1147. - PubMed

Publication types

LinkOut - more resources