. 2006 Mar 23;34(6):1711-20.
doi: 10.1093/nar/gkl076. Print 2006.

Protein assembly and DNA looping by the FokI restriction endonuclease

Affiliations

Protein assembly and DNA looping by the FokI restriction endonuclease

Lucy E Catto et al. Nucleic Acids Res. .

Abstract

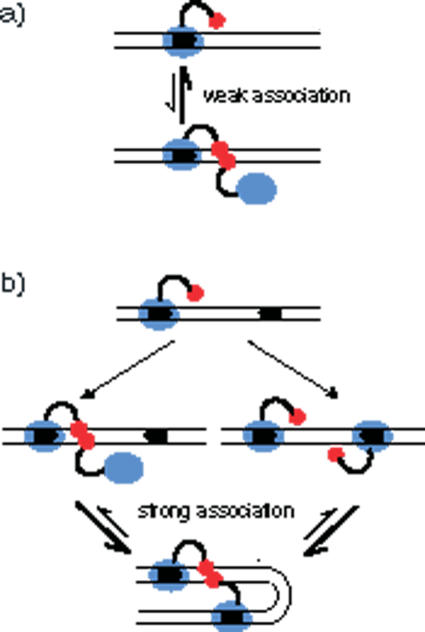
The FokI restriction endonuclease recognizes an asymmetric DNA sequence and cuts both strands at fixed positions upstream of the site. The sequence is contacted by a single monomer of the protein, but the monomer has only one catalytic centre and forms a dimer to cut both strands. FokI is also known to cleave DNA with two copies of its site more rapidly than DNA with one copy. To discover how FokI acts at a single site and how it acts at two sites, its reactions were examined on a series of plasmids with either one recognition site or with two sites separated by varied distances, sometimes in the presence of a DNA-binding defective mutant of FokI. These experiments showed that, to cleave DNA with one site, the monomer bound to that site associates via a weak protein-protein interaction with a second monomer that remains detached from the recognition sequence. Nevertheless, the second monomer catalyses phosphodiester bond hydrolysis at the same rate as the DNA-bound monomer. On DNA with two sites, two monomers of FokI interact strongly, as a result of being tethered to the same molecule of DNA, and sequester the intervening DNA in a loop.


Figures

Figure 1
Figure 1
Schematic representation for the FokI monomer on DNA with one (a) or two (b) recognition sites. In both, the N-terminal DNA-binding domain of the FokI protein (43) is shown as a blue oval, its C-terminal catalytic/dimerization domain as a red circle and the linker between the domains as a black curve. The two strands of the DNA are shown as parallel lines and the FokI recognition sites as filled arrows (to mark their orientations). In (a), the monomer bound to the solitary recognition site associates weakly with a second monomer via its C-terminal domain to give an unstable dimer. The two catalytic domains each engage one strand of the DNA downstream of the recognition site (the assignment of target strands to monomers is arbitrary) but only one of the two DNA-binding contacts the recognition sequence. In (b), the DNA carrying a monomer of FokI at one of its two sites binds a second monomer; either to form a dimer at the initial site (left-hand pathway) or as a monomer at the second site (right-hand pathway). Both routes then lead to the dimer bound to both recognition sites via their N-terminal domains and to both strands of the DNA at one (arbitrary) cleavage site, via their C-terminal domains, with the intervening DNA trapped in a loop. The tethering of both monomers to the same chain strengthens their association and results in a stable dimer.
Figure 2
Figure 2
Plasmids with two FokI sites. (a) The plasmids constructed here, pIF170–pIF199, contained two copies of the recognition sequence for FokI (in red), in inverted (head-to-head) orientation (as indicated by the arrows encompassing the sequences). The positions where FokI bound to either left- or right-hand recognition sites cleave the DNA are marked with jagged lines. The distances between the sites are measured from recognition sequence to recognition sequence (noted as x) rather from the cleavage positions. (b) The reaction contained 2 nM FokI and 10 nM 3H-labelled pIF185 (90% in its SC form, 10% as OC) in Reaction Buffer at 37°C. After adding the enzyme, aliquots were removed from the reaction at the times indicated above each lane, mixed immediately with Stop-Mix, and subsequently subjected to electrophoresis through agarose. The electrophoretic mobilities of the SC and the OC forms of pIF185 are indicated on the left: on the right, the 2983 bp product from cutting pIF185 at one FokI site and the 2820 bp product from cutting both sites (the other product from cutting both sites is 163 bp and migrates off the end of the gel). (c) The concentrations of the following forms of DNA from the reaction in (b) were determined by scintillation counting: supercoiled DNA substrate (blue squares, marked SC); open circle DNA (red circles, marked OC); sum of the linear products cut at one and at two FokI sites, (green triangles, marked LIN).
Figure 3
Figure 3
FokI cleavage of DNA with one or two sites. (a) Reactions contained 0.5 nM wild-type FokI endonuclease and 10 nM DNA in Reaction Buffer at 37°C: either pSKFokI, a plasmid with one FokI site (black circles); or pIF185, a plasmid with two FokI sites (black squares). Samples were removed from the reactions at timed intervals and the residual concentrations of the SC substrate measured as in Material and Methods. Additional reactions of wild-type FokI on pSKFokI were carried out as above except for the addition of the N13Y mutant of FokI at one of the following concentrations; 20 nM (red triangles), 50 nM (green triangles), 100 nM (blue triangles). (b) Initial rates for the utilization of the SC substrate were measured from reactions containing 0.5 nM wild-type FokI and 10 nM pSKFokI, as above, in the presence of the N13Y mutant at the concentration indicated on the x-axis. Each data point is the mean of ≥2 independent reactions; error bars indicate SDs. The velocities on the y-axis are given in terms of mol DNA consumed/mol wild-type FokI/min. The red line is the optimal fit of the data to Equation 1, which gave: v0 = 0.046 ± 0.003 mol/mol/min; v = 0.91 ± 0.19 mol/mol/min; KDm = 166 ± 73 nM.
Figure 4
Figure 4
Single-turnovers of wild-type FokI. (a) FokI endonuclease was incubated with pSKFokI (a plasmid with one FokI site) before adding magnesium acetate, to give a reaction that contained 50 nM FokI and 2.5 nM 3H-labelled DNA (∼95% SC) in Reaction Buffer at 37°C. Samples were removed from the reactions at timed intervals and analysed as in Materials and Methods to determine the concentrations of the following forms of the DNA: SC DNA, blue squares; OC DNA, red circles; LIN DNA, green triangles. The changes in the concentrations of all three forms of the DNA were fitted globally to the kinetic equations for a two-step reaction scheme (Equation 2), to give values for the apparent rate constants ka and kb: the lines shown are the best fits. (b) Reactions at varied concentrations of FokI endonuclease were carried out as in (a) and, in each case, values for ka and kb determined as above. The dependence of ka on the enzyme concentration was fitted to Equation 4. The best fit (red line) was obtained with KDw = 99 ± 19 nM and k2 = 3.2 ± 0.3 min−1. In both (a) and (b), each data point is the mean of ≥2 independent repeats: error bars indicate SDs.
Figure 5
Figure 5
Varied spacings between two FokI sites. Reactions contained 2 nM wild-type FokI endonuclease and 10 nM plasmid (≥85% supercoiled) in Reaction Buffer at 37°C. The DNA was one from the series pIF170–pIF199, which each contain two FokI sites in inverted orientation separated by the number of base pairs indicated. (a) Reaction velocities were determined from the decline in the concentration of each supercoiled substrate with time and are plotted against the inter-site spacing for that plasmid. The dashed line indicates the mean of the velocities across the series. (b) The maximal concentration of OC DNA generated during each reaction was measured and the concentration of the enzyme subtracted from these values, to give the excess of OC DNA over the enzyme. The excess is plotted against the inter-site spacing and the data fitted to the equation for a sine wave, y = A.sin(ω.x + P) + offset (where A, ω and P denote the amplitude, periodicity and phase, respectively). The line shows the optimal fit, which was obtained with a periodicity of 9.9 ± 0.4 bp. In both (a) and (b), each data point is the mean from more than three independent measurements; error bars indicate SE of means.

Similar articles

Cited by

References

    1. Roberts R.J., Vincze T., Posfai J., Macelis D. REBASE—restriction enzymes and DNA methyltransferases. Nucleic Acids Res. 2005;33:D230–D232. - PMC - PubMed
    1. Lagunavicius A., Sasnauskas G., Halford S.E., Siksnys V. The metal-independent Type IIs restriction enzyme BfiI is a dimer that binds two DNA sites but has only one catalytic centre. J. Mol. Biol. 2003;326:1051–1064. - PubMed
    1. Halford S.E. Hopping, jumping and looping by restriction enzymes. Biochem. Soc. Trans. 2001;29:363–373. - PubMed
    1. Pingoud A., Fuxreiter M., Pingoud V., Wende W. Type II restriction endonucleases: structure and mechanism. Cell. Mol. Life Sci. 2005;62:685–707. - PMC - PubMed
    1. Aggarwal A.K. Structure and function of restriction endonucleases. Curr. Opin. Struct. Biol. 1995;5:11–19. - PubMed

Publication types

Substances