

Comparison of the SF-6D and the EQ-5D in patients with coronary heart disease
- PMID: 16563170
- PMCID: PMC1475841
- DOI: 10.1186/1477-7525-4-20
Comparison of the SF-6D and the EQ-5D in patients with coronary heart disease
Abstract
Background: The SF-6D was derived from the SF-36. A single summary score is obtained allegedly preserving the descriptive richness and sensitivity to change of the SF-36 into utility measurement. We compared the SF-6D and EQ-5D on domain content, scoring distribution, pre-treatment and change scores.
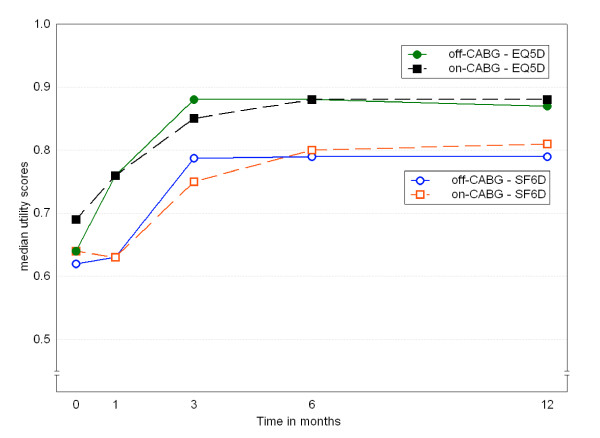
Methods: The SF-6D and the EQ-5D were completed prior to intervention and 1, 3, 6 and 12 months post-intervention in a study enrolling 561 patients with symptomatic coronary stenosis. Patients were randomized to off-pump coronary artery bypass surgery (CABG), standard on-pump CABG, or percutaneous transluminal coronary angioplasty (PTCA). Baseline and change over time scores were compared using parametric and non-parametric tests.
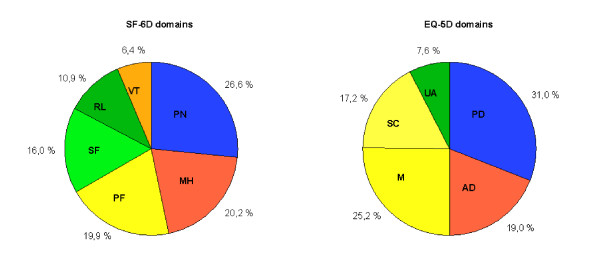
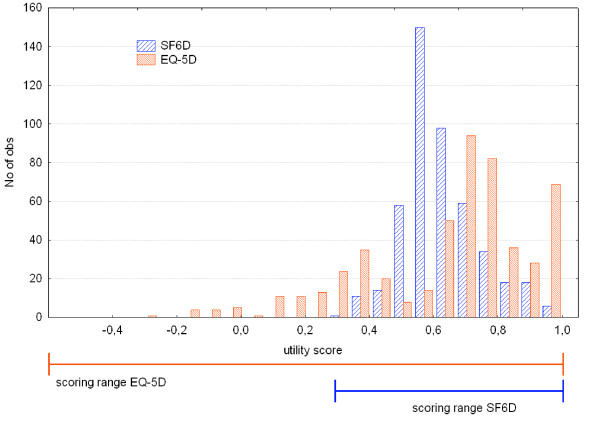
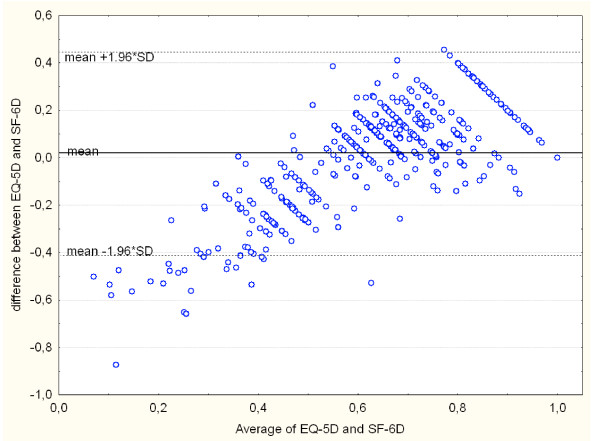
Results: The relative contribution of similar domains measuring daily functioning to the utility scores differed substantially. SF-6D focused more on social functioning, while EQ-5D gave more weight to physical functioning. Pain and mental health had similar contributions. The scoring range of the EQ-5D was twice the range of the SF-6D. Before treatment, EQ-5D and SF-6D mean scores appeared similar (0.64 versus 0.63, p = 0.09). Median scores, however, differed substantially (0.69 versus 0.60), a difference exceeding the minimal important difference of both instruments. Agreement was low, with an intra-class correlation of 0.45.Finally, we found large differences in measuring change over time. The SF-6D recorded greater intra-subject change in the PTCA-group. Only the EQ-5D recorded significant change in the CABG-groups. In the latter groups changes in SF-6D domains cancelled each other out.
Conclusion: Although both instruments appear to measure similar constructs, the EQ-5D and SF-6D are quite different. The low agreement and the differences in median values, scoring range and sensitivity to change after intervention show that the EQ-5D and SF-6D yield incomparable scores in patients with coronary heart disease.
Figures
Similar articles
-
A comparison of utility measurement using EQ-5D and SF-6D preference-based generic instruments in patients with rheumatoid arthritis.Clin Exp Rheumatol. 2011 Jul-Aug;29(4):661-71. Epub 2011 Aug 31. Clin Exp Rheumatol. 2011. PMID: 21813061
-
A comparison of SF-6D and EQ-5D utility scores in a study of patients with schizophrenia.J Ment Health Policy Econ. 2009 Mar;12(1):27-31. J Ment Health Policy Econ. 2009. PMID: 19346564 Clinical Trial.
-
Comparison of the EQ-5D and the SF-6D utility measures in 813 patients with early arthritis: results from the ESPOIR cohort.J Rheumatol. 2011 Aug;38(8):1576-84. doi: 10.3899/jrheum.101006. Epub 2011 May 1. J Rheumatol. 2011. PMID: 21532054
-
Comparison of the minimally important difference for two health state utility measures: EQ-5D and SF-6D.Qual Life Res. 2005 Aug;14(6):1523-32. doi: 10.1007/s11136-004-7713-0. Qual Life Res. 2005. PMID: 16110932 Review.
-
A review of the psychometric properties of generic utility measures in multiple sclerosis.Pharmacoeconomics. 2014 Aug;32(8):759-73. doi: 10.1007/s40273-014-0167-5. Pharmacoeconomics. 2014. PMID: 24846760 Review.
Cited by
-
Discriminative capacity of the EQ-5D, SF-6D, and SF-12 as measures of health status in population health survey.Qual Life Res. 2010 Aug;19(6):853-64. doi: 10.1007/s11136-010-9639-z. Epub 2010 Mar 31. Qual Life Res. 2010. PMID: 20354795
-
Cost-effectiveness of adjunctive eptifibatide in patients undergoing coronary stenting in Germany.Eur J Health Econ. 2012 Aug;13(4):381-91. doi: 10.1007/s10198-011-0310-6. Epub 2011 Apr 12. Eur J Health Econ. 2012. PMID: 21484498
-
Estimating health utilities in patients with asthma and COPD: evidence on the performance of EQ-5D and SF-6D.Qual Life Res. 2009 Mar;18(2):267-72. doi: 10.1007/s11136-008-9429-z. Epub 2008 Dec 23. Qual Life Res. 2009. PMID: 19105049
-
Comparison of direct and indirect methods of estimating health state utilities for resource allocation: review and empirical analysis.BMJ. 2009 Jul 22;339:b2688. doi: 10.1136/bmj.b2688. BMJ. 2009. PMID: 22128393 Free PMC article. Review.
-
The classification systems of the EQ-5D, the HUI II and the SF-6D: what do they have in common?Qual Life Res. 2009 Nov;18(9):1249-61. doi: 10.1007/s11136-009-9525-8. Epub 2009 Sep 1. Qual Life Res. 2009. PMID: 19728160
References
-
- Rabin R, de Charro F. EQ-5D: a measure of health status from the EuroQol Group. Ann Med. 2001;33:337–343. - PubMed
-
- Furlong WJ, Feeny DH, Torrance GW, Barr RD. The Health Utilities Index (HUI) system for assessing health-related quality of life in clinical studies. Ann Med. 2001;33:375–384. - PubMed
-
- Ware JE, Snow KK, Kosinski M, Gandek B. SF-36 Health Survey Manual and Interpretation Guide. Boston, MA, New England Medical Center, The Health Institute; 1993.
Publication types
MeSH terms
LinkOut - more resources
Full Text Sources
Medical
