Sodium and proton diffusion MRI as biomarkers for early therapeutic response in subcutaneous tumors
- PMID: 16563956
- PMCID: PMC3127446
- DOI: 10.1016/j.mri.2005.12.004
Sodium and proton diffusion MRI as biomarkers for early therapeutic response in subcutaneous tumors
Abstract
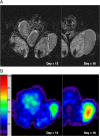
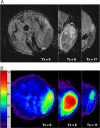
The ability to quantitate early effects of tumor therapeutic response using noninvasive imaging would have a major impact in clinical oncology. One area of active research interest is the ability to use MR techniques to detect subtle changes in tumor cellular density. In this study, sodium and proton diffusion MRI were compared for their ability to detect early cellular changes in tumors treated with a cytotoxic chemotherapy. Subcutaneous 9L gliosarcomas were treated with a single dose of 1,3-bis(2-chloroethyl)-1-nitrosourea. Both sodium and diffusion imaging modalities were able to detect changes in tumor cellularity as early as 2 days after treatment, which continued to evolve as increased signal intensities reached a maximum approximately 8 days posttreatment. Early changes in tumor sodium and apparent diffusion coefficient values were predictive of subsequent tumor shrinkage, which occurred approximately 10 days later. Overall, therapeutical induced changes in sodium and diffusion values were found to have similar dynamic and spatial changes. These findings suggest that these imaging modalities detected similar early cellular changes after treatment. The results of this study support the continued clinical testing of diffusion MRI for evaluation of early tumor treatment response and demonstrate the complementary insights of sodium MRI for oncology applications.
Figures


Similar articles
-
Proton and sodium MRI assessment of emerging tumor chemotherapeutic resistance.NMR Biomed. 2006 Dec;19(8):1035-42. doi: 10.1002/nbm.1074. NMR Biomed. 2006. PMID: 16894643 Free PMC article.
-
Sodium magnetic resonance imaging of chemotherapeutic response in a rat glioma.Magn Reson Med. 2005 Jan;53(1):85-92. doi: 10.1002/mrm.20332. Magn Reson Med. 2005. PMID: 15690506 Free PMC article.
-
Earlier detection of tumor treatment response using magnetic resonance diffusion imaging with oscillating gradients.Magn Reson Imaging. 2011 Apr;29(3):315-23. doi: 10.1016/j.mri.2010.10.003. Epub 2010 Dec 28. Magn Reson Imaging. 2011. PMID: 21190804 Free PMC article.
-
The functional diffusion map: an imaging biomarker for the early prediction of cancer treatment outcome.Neoplasia. 2006 Apr;8(4):259-67. doi: 10.1593/neo.05844. Neoplasia. 2006. PMID: 16756718 Free PMC article.
-
Effects of chemotherapy by 1,3-bis(2-chloroethyl)-1-nitrosourea on single-quantum- and triple-quantum-filtered 23Na and 31P nuclear magnetic resonance of the subcutaneously implanted 9L glioma.Cancer Res. 2001 Mar 1;61(5):2002-7. Cancer Res. 2001. PMID: 11280759
Cited by
-
Clinical applications of imaging biomarkers. Part 3. The neuro-oncologist's perspective.Br J Radiol. 2011 Dec;84 Spec No 2(Spec Iss 2):S209-12. doi: 10.1259/bjr/38240981. Br J Radiol. 2011. PMID: 22433830 Free PMC article. Review.
-
Hyponatremia and Cancer Progression: Possible Association with Sodium-Transporting Proteins.Bioelectricity. 2020 Mar 1;2(1):14-20. doi: 10.1089/bioe.2019.0035. Epub 2020 Mar 18. Bioelectricity. 2020. PMID: 34471833 Free PMC article.
-
Use of MRI, metabolomic, and genomic biomarkers to identify mechanisms of chemoresistance in glioma.Cancer Drug Resist. 2019 Sep 19;2(3):862-876. doi: 10.20517/cdr.2019.18. eCollection 2019. Cancer Drug Resist. 2019. PMID: 35582585 Free PMC article. Review.
-
²³Na-MRI of recurrent glioblastoma multiforme after intraoperative radiotherapy: technical note.Neuroradiology. 2015 Mar;57(3):321-6. doi: 10.1007/s00234-014-1468-2. Epub 2014 Nov 27. Neuroradiology. 2015. PMID: 25428586
-
Proton and sodium MRI assessment of emerging tumor chemotherapeutic resistance.NMR Biomed. 2006 Dec;19(8):1035-42. doi: 10.1002/nbm.1074. NMR Biomed. 2006. PMID: 16894643 Free PMC article.
References
-
- Ross BD, Moffat BA, Lawrence TS, Mukherji SK, Gebarski SS, Quint DJ, et al. Evaluation of cancer therapy using diffusion magnetic resonance imaging. Mol Cancer Ther. 2003;2(6):581–7. - PubMed
-
- Chenevert TL, Meyer CR, Moffat BA, Rehemtulla A, Mukherji SK, Gebarski SS, et al. Diffusion MRI: a new strategy for assessment of cancer therapeutic efficacy. Mol Imaging. 2002;1(4):336–43. - PubMed
-
- Bartha R, Lee TY, Hogan MJ, Hughes S, Barberi E, Rajakumar N, et al. Sodium T2*-weighted MR imaging of acute focal cerebral ischemia in rabbits. Magn Reson Imaging. 2004;22(7):983–91. - PubMed
Publication types
MeSH terms
Substances
Grants and funding
LinkOut - more resources
Full Text Sources
Other Literature Sources
Medical
Miscellaneous

