. 2006 Jun 15;90(12):4500-8.
doi: 10.1529/biophysj.106.081026. Epub 2006 Mar 24.

Effects of ceramide on liquid-ordered domains investigated by simultaneous AFM and FCS

Affiliations

Effects of ceramide on liquid-ordered domains investigated by simultaneous AFM and FCS

Salvatore Chiantia et al. Biophys J. .

Erratum in

  • Biophys J. 2007 Jan 15;92(2):696

Abstract

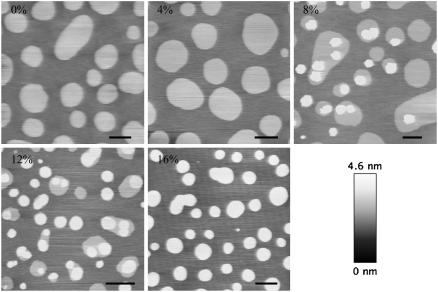
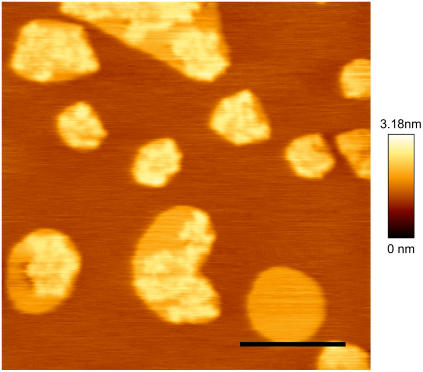
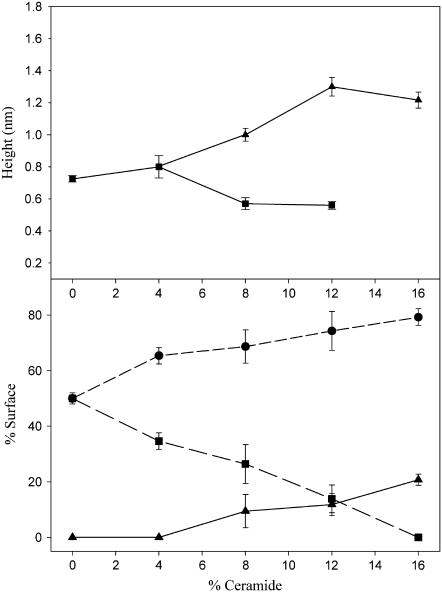
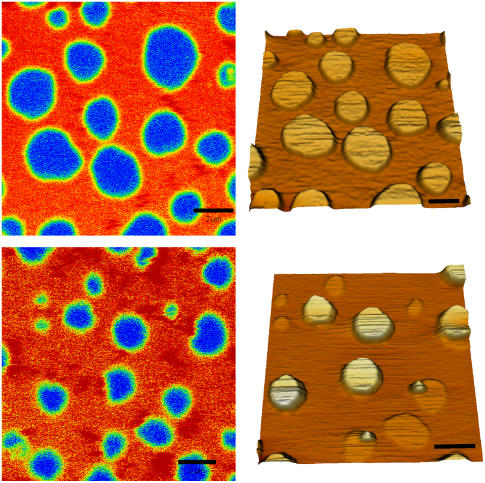
The sphingolipid ceramides are known to influence lipid lateral organization in biological membranes. In particular, ceramide-induced alterations of microdomains can be involved in several cell functions, ranging from apoptosis to immune response. We used a combined approach of atomic force microscopy, fluorescence correlation spectroscopy, and confocal fluorescence imaging to investigate the effects of ceramides in model membranes of biological relevance. Our results show that physiological quantities of ceramide in sphingomyelin/dioleoylphosphatidylcholine/cholesterol supported bilayers lead to a significant rearrangement of lipid lateral organization. Our experimental setup allowed a simultaneous characterization of both structural and dynamic modification of membrane microdomains, induced by the presence of ceramide. Formation of similar ceramide-enriched domains and, more general, alterations of lipid-lipid interactions can be of crucial importance for the biological function of cell membranes.


Figures

FIGURE 1
FIGURE 1
AFM topographical images of SLB at different Cer concentrations, at room temperature. The lipid composition was DOPC:cholesterol:(SM+Cer) 1:1:1 molar and SM was gradually substituted for ceramide. In the 0% and 4% samples, two different phases with a height step of ∼0.8 nm can be readily distinguished. In all of the remaining images, a third topographical level can be identified at ∼1.2 nm above the surrounding lowest phase. Scale bar = 2 μm.
FIGURE 2
FIGURE 2
AFM topographical image of a SLB made of DOPC/cholesterol/SM/Cer 1:1:0.76:0.24 molar (8% Cer) at room temperature. Three different phases can be readily distinguished at a relative height of 0, 0.6, and 1 nm. The first two most likely correspond to the liquid-disordered and liquid-ordered domains, respectively. The lightest phase presents irregular features and contours. Scale bar = 2 μm.
FIGURE 3
FIGURE 3
Topographical features of ceramide-containing SLBs. In the upper panel, height differences between the domains at the intermediate height and the surrounding lipid matrix (squares), and between the highest domains and the surrounding lipid matrix (triangles), as a function of ceramide content. In the lower panel, surface fraction occupied by the lowest phase (circles), intermediate phase (squares), or highest phase (triangles), as a function of ceramide content. Error bars represent the standard deviations of the measurements.
FIGURE 4
FIGURE 4
Fluorescence image (left) and AFM topographical data (right) acquired on the same spot of the membrane at room temperature. The upper panel refers to a DOPC/cholesterol/SM/Cer 1:1:0.88:0.12 sample (4% Cer), the lower panel to a DOPC/cholesterol/SM/Cer 1:1:0.64:0.36 sample (12% Cer). The fluorescent lipid RhoPE was added at 0.1% molar concentration in the lipid mixture.
FIGURE 5
FIGURE 5
Typical averaged autocorrelation curves, measured in the DOPC-rich phase for three different samples containing 0% (green), 8% (black), and 16% (red) ceramide. The fluorescent lipid RhoPE was included in 0.005% molar concentration. All measurements were performed at room temperature. For each ceramide content, the final diffusion times τD were computed from the analysis of ∼140 curves: three autocorrelation curves, at approximately eight different z-positions in six independent measurement spots. (Inset) Diffusion times τD for different heights z of the detection volume (16% ceramide). Diffusion times were obtained by fitting the autocorrelation curves to a one-component two-dimensional Brownian diffusion model. (Solid line) Fit to second-order polynomial to determine the minimum diffusion time.
FIGURE 6
FIGURE 6
Relative diffusion coefficient D* for the DOPC-rich phase as function of the ceramide content. D* is computed assuming a mean value w0 = 0.29 μm for all of the samples. To convey a general estimate of the uncertainty associated with these measurements, the error bars represent the average of the standard deviations of all the experimental points.
FIGURE 7
FIGURE 7
Time course of a micromanipulation experiment, in which ordered domains are deformed by the AFM tip. The upper series of panels shows the deformation and relaxation of two domains at intermediate height in a DOPC/cholesterol/SM 1:1:1 sample (0% Cer), followed using fluorescence imaging. The circular shape of the domains is fully recovered in a few minutes. The lower series of panels shows AFM images of the same procedure on the highest domains, in a DOPC/cholesterol/SM/Cer 1:1:0.52:0.48 sample (16% Cer). In this case, after ∼1 h after the deformation, the contour of the domains was still irregular. Measurements were performed at room temperature. Scale bars = 2 μm.
FIGURE 8
FIGURE 8
Panels AF show a time-course measurement on two DOPC/cholesterol/SM/:1:1:1 samples, after addition of SMase at room temperature. The enzyme was injected at the beginning of the scans represented in panels A, for the first experiment, and E for the second. Imaging time was set to 4 min. Panels F and G, in particular, show typical topographical features of the membrane that could be observed after the action of SMase. In the right lower corner, the structures of SM C18:0 and ceramide C18:0 are shown. The red circle indicates the SM phosphocholine group, which is removed by the action of SMase. Scale bars = 2 μm.

References

    1. Singer, S. J., and G. L. Nicolson. 1972. Fluid mosaic model of structure of cell-membranes. Science. 175:720–731. - PubMed
    1. Barenholz, Y., and T. E. Thompson. 1980. Sphingomyelins in bilayers and biological-membranes. Biochim. Biophys. Acta. 604:129–158. - PubMed
    1. Anderson, R. G. W. 1998. The caveolae membrane system. Annu. Rev. Biochem. 67:199–225. - PubMed
    1. Mayor, S., and M. Rao. 2004. Rafts: scale-dependent, active lipid organization at the cell surface. Traffic. 5:231–240. - PubMed
    1. Simons, K., and E. Ikonen. 1997. Functional rafts in cell membranes. Nature. 387:569–572. - PubMed

Publication types

LinkOut - more resources