. 2006 Jun 15;90(12):4418-27.
doi: 10.1529/biophysj.105.076570. Epub 2006 Mar 24.

Uncoupling store-operated Ca2+ entry and altered Ca2+ release from sarcoplasmic reticulum through silencing of junctophilin genes

Affiliations

Uncoupling store-operated Ca2+ entry and altered Ca2+ release from sarcoplasmic reticulum through silencing of junctophilin genes

Yutaka Hirata et al. Biophys J. .

Abstract

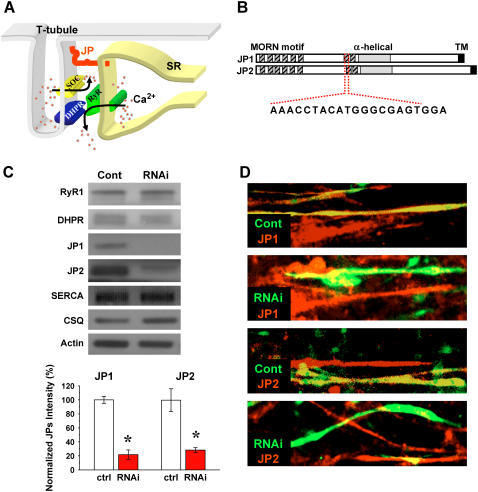
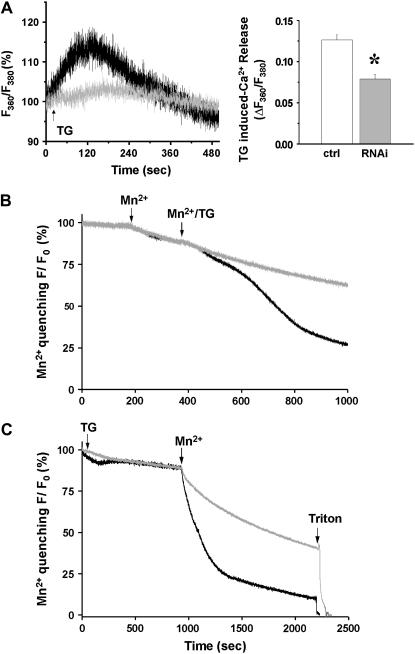
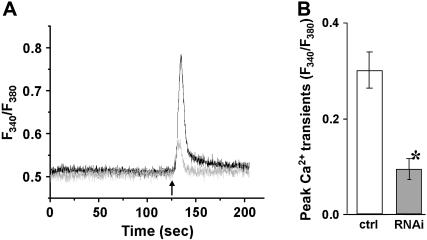
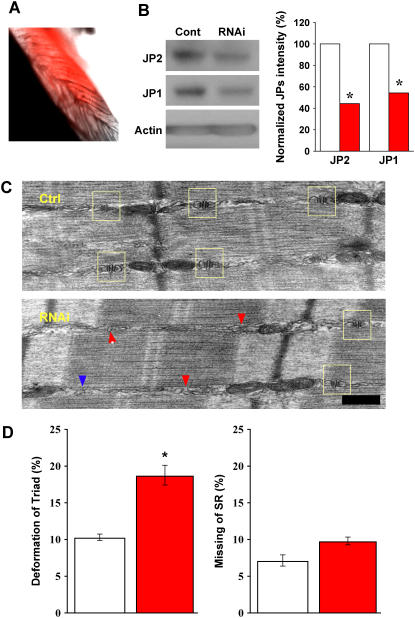
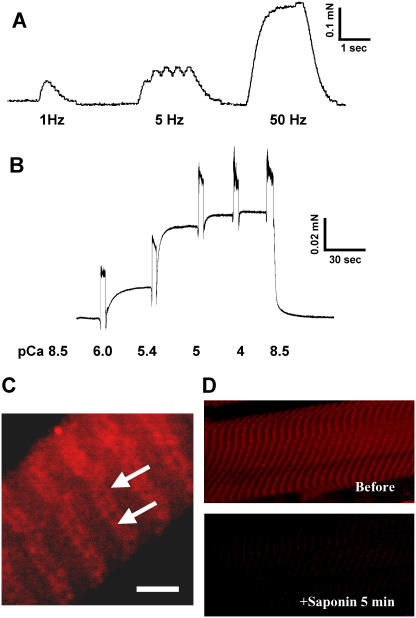
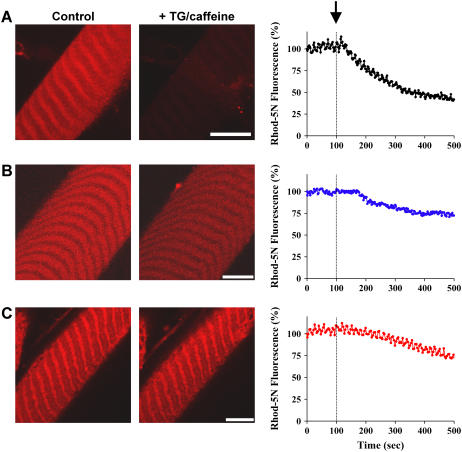
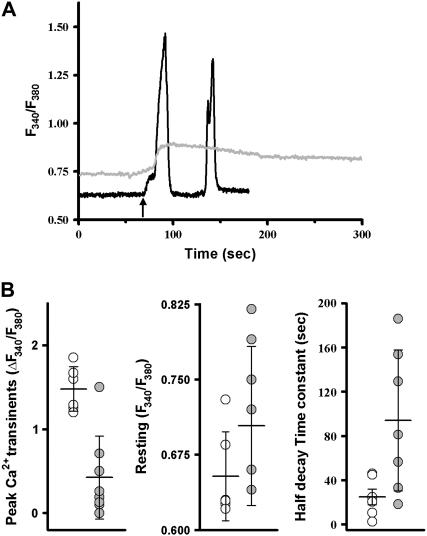
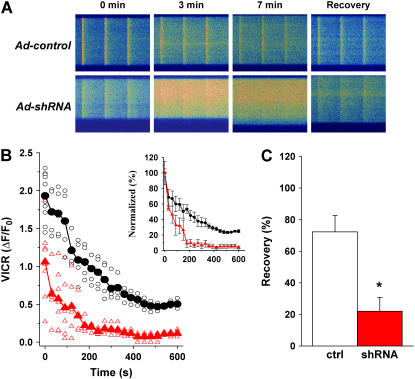
Junctophilin (JP) mediates the close contact between cell surface and intracellular membranes in muscle cells ensuring efficient excitation-contraction coupling. Here we demonstrate that disruption of triad junction structure formed by the transverse tubular (TT) invagination of plasma membrane and terminal cisternae of sarcoplasmic reticulum (SR) by reduction of JP expression leads to defective Ca2+ homeostasis in muscle cells. Using adenovirus with small hairpin interference RNA (shRNA) against both JP1 and JP2 genes, we could achieve acute suppression of JPs in skeletal muscle fibers. The shRNA-treated muscles exhibit deformed triad junctions and reduced store-operated Ca2+ entry (SOCE), which is likely due to uncoupled retrograde signaling from SR to TT. Knockdown of JP also causes a reduction in SR Ca2+ storage and altered caffeine-induced Ca2+ release, suggesting an orthograde regulation of the TT membrane on the SR Ca2+ release machinery. Our data demonstrate that JPs play an important role in controlling overall intracellular Ca2+ homeostasis in muscle cells. We speculate that altered expression of JPs may underlie some of the phenotypic changes associated with certain muscle diseases and aging.


Figures

FIGURE 1
FIGURE 1
JP and TT/SR coupling and shRNA-mediated suppression of JP in mammalian skeletal muscle. (A) JP is a unique protein that spans the junctional gap between TT invagination of cell surface membrane and terminal cisternae of SR in muscle cells. DHPR is represented in blue, RyR is shown in green, store-operated Ca2+ channel is shown in yellow, and JP is in red. (B) The functional motifs of JP are divided into three domains: a TM sequence inserted into the SR membrane, repeated “MORN” sequences that adhere to the TT membrane, and an α-helical-rich structure in the middle. The listed nucleotide sequence represents the siRNA target. (C) Western blot of JP1 and JP2 expression in siRNA oligonucleotide transfected C2C12 myotubes performed at day 5 after myotube differentiation, providing over 95% transfection efficiency. Controls represent muscles transfected with a scramble siRNA probe. p-values of ≤0.01 were considered as significant (same criteria in following figures). Normalized protein levels with actin show that shRNAs significantly knock down both JP1 and JP2 (lower panel, n = 5–8, p = 2.11529E-7 and 0.00358, respectively) but do not affect the expression of RyR1, DHPR, SERCA2, and CSQ in C2C12 myotubes. (D) Immunostaining of C2C12 myotubes transfected with the pU6-EGFP (with luciferase shRNA as control) and pU6-EGFP (shRNA), providing ∼30% transfection efficiency. Transfected cells are labeled with GFP, and red fluorescence represents staining of JP1 and JP2 with specific antibodies. Any yellow fluorescence in RNAi panels likely results from the presence of overlapping nontransfected myotubes in the cell layers. These pictures were representative of 16 experiments.
FIGURE 2
FIGURE 2
Uncoupled SOCE activation in C2C12 cells after silencing of JP1 and JP2. (A) Representative traces of percentage changes in ratio of fluorescence at excitation of 360 and 380 show that addition of 20 μM TG (arrow) induced passive Ca2+ release from SR Ca2+ stores (left panel). In JP shRNA-treated C2C12 myotubes (gray, n = 4), SR Ca2+ stores are significantly less than that in myotubes transfected with pU6-EGFP-control plasmids (black, n = 5) indicated by reduced TG-releasable Ca2+ (right panel). (B) Quenching of intracellular Fura-2 fluorescence by the entry of extracellular Mn2+ (0.5 mM) reveals graded and sigmoidal activation of SOCE in C2C12 myotubes transfected with control plasmids (black, n = 5). In JP shRNA-treated C2C12 myotubes (gray) the sigmoidal phase of Fura-2 quenching by Mn2+ was completely absent, indicating defective SOCE (n = 4). (C) To examine the changes in the maximum degree of SOCE activation, C2C12 cells were incubated with TG for an extended period of time to ensure complete depletion of their SR Ca2+ stores. Compared with the control (n = 4, maximum quenching rate is −9.96 ± 0.88%/min), the maximum activation of SOCE was reduced in siRNA-transfected C2C12 myotubes (n = 5, maximum quenching rate is −4.99 ± 1.40%/min) by ∼50%. p < 0.005.
FIGURE 3
FIGURE 3
Reduced caffeine-induced Ca2+ release in C2C12 cells after silencing of JP1 and JP2. C2C12 myotubes transfected with pU6-EGFP-shRNA (gray) or pU6-EGFP-control (black) were loaded with 5 μM Fura-2-AM. Individual transfected cells were selected for Ca2+ measurements by the presence of a GFP marker. (A) A total of 10 mM caffeine was added to the extracellular solution without Ca2+, indicated by an arrow. Cells transfected with the shRNA plasmid displayed a smaller amplitude in caffeine-induced Ca2+ transients than in control cells. (B) The difference in peak amplitude of caffeine-induced Ca2+ transients is statistically significant between the control and shRNA-treated C2C12 myotubes (n ≥ 15, p < 0.01). Data are presented as mean ± SE.
FIGURE 4
FIGURE 4
Suppression of JP1 and JP2 leads to defective triad junction in skeletal muscle. (A) A typical sample of FDB muscle infected with adenovirus packaged with shRNA against JP1 and JP2, taken 4 days postinjection of virus. Red color represents RFP fluorescence, indicating infected fibers. (B) Western blot of JP1 and JP2 expression in skeletal muscle fibers, 4 days postinfection with adenoviruses packaged with nonspecific shRNA (control) and specific shRNA against JP1 and JP2 (RNAi). Similar to results in C2C12 cells, normalized protein levels with actin show that shRNAs significantly knock down both JP1 and JP2. (C) Defective triad junction in skeletal muscle, examined by EM. Top panel shows a typical muscle fiber from the Ad-cont-infected mice, and the bottom panel shows a typical muscle fiber from the Ad-shRNA-infected mice. Scale bar indicates 0.2 μm. The sides of A-I junctional regions of myofibrils where triads are expected to be present were observed. In the case where normal paired triad junctions (yellow box) flanking each Z-disk could not be observed by eye, such regions were assigned “deformed triad”. TT and SR without coupling were seen in the “deformed triad”, and such membrane structures were not seen very frequently at the regions analyzed (<20% in all counted). Muscle infected with Ad-cont resembles wild-type, with normal SR/TT/SR architecture (yellow box), whereas in Ad-shRNA-infected muscle triad junctions are frequently deformed (red arrow) or missing (blue arrow). (D) Bar graph shows the summarized data obtained from the EM analyses of more than 1000 A-I junctional regions from 11 muscle specimens obtained from 6 different animals. p = 0.00381 (left panel) and 0.0453 (right panel). To insure accuracy in morphological assessment, we increased stringency for statistical significance. p-value <0.01 was considered statistical significance. Data presented as mean ± SE.
FIGURE 5
FIGURE 5
Cultured skeletal muscle fibers maintain structural and functional integrity. (A) An intact EDL muscle fiber after culturing for 4 days was mounted onto an optoelectric force transducer as previously described (7,25). Presented trace is force produced upon electrical stimulation at 1, 5, and 50 Hz. (B) Cultured EDL fibers were permeabilized with Triton X-100. Ca2+-activated contractile force was measured at indicated pCa. Secondary upward inflections in the force tracings are mechanical artifacts of transferring a fiber between chambers with different pCa conditions. (C) Confocal imaging of Rhod-5N trapped inside the sealed TT membranes. Arrows indicate the doublet pattern in TT membranes typical of mammalian skeletal muscle. Similar results were obtained in at least three experiments. Scale bar represents 5 μm. (D) To confirm dye localization and the absence of cross loading of TT and SR, fiber was exposed for 5 min to a relaxing solution containing 50 μg/ml saponin, which only hyperpermeabilizes the sarcolemma, leaving the SR intact. Fluorescence levels in saponin-treated fibers decreased to levels comparable to background levels, suggesting that Rhod-5N was primarily localized in the TT.
FIGURE 6
FIGURE 6
Uncoupling of SOCE in skeletal muscle infected with shRNA for JP1 and JP2. (A) Time-dependent changes of Rhod-5N fluorescence in skinned EDL fibers infected with Ad-control viruses were monitored using a confocal microscope after addition of 20 μM TG and 30 mM caffeine (marked by arrow). Gradual decrease in Rhod-5N fluorescence indicates SOCE activity (n = 9). (B) Preincubation of the skinned muscle fiber (treated with Ad-control) with 50 μM 2-APB significantly prevented the decrease of Rhod-5N fluorescence after the addition of TG and caffeine (n = 9). (C) Viral-mediated delivery of the shRNA for JP1 and JP2 into the EDL muscle fiber resulted in uncoupling of SOCE in the skinned muscle preparation. The TG- and caffeine-triggered decrease of Rhod-5N fluorescence was significantly less in the Ad-shRNA-infected muscle fiber (n = 8). Traces on the right are mean values for the indicated number of experiments per condition. The scale bars represent 5 μm for all images.
FIGURE 7
FIGURE 7
Altered CICR activity in skeletal muscle with suppression of JP1 and JP2. (A) Viral-infected, enzymatically dissociated FDB muscles were loaded with 5 μM Fura-2-AM. A total of 10 mM caffeine was added to the extracellular solution containing 0 [Ca2+] (arrow). Fibers infected with Ad-control virus (black) responded with rapid caffeine-induced Ca2+ transients with a sharp decaying phase. Occasionally, a second spontaneous Ca2+ transient occurred in the presence of caffeine, probably reflecting contraction induced in the continuous exposure to caffeine. Fibers infected with Ad-shRNA virus (gray) displayed elevated resting cytosolic [Ca2+] as well as smaller and prolonged caffeine-induced Ca2+ transients. (B) Averaged data from multiple experiments. Open circles (Ad-control) or solid circles (Ad-shRNA) represent individual fibers, horizontal bar represents the mean, and error bars are one standard deviation (n = 7–12); p-values for peak Ca2+ transient, half decay time, and resting Ca2+ are 0.0001, 0.03, and 0.00153, respectively. Statistical outliers (2 ± SD as cutoff value) were excluded.
FIGURE 8
FIGURE 8
Abnormal maintenance of intracellular Ca2+ storage in skeletal muscle with suppression of JP1 and JP2. (A) Confocal line scan measurement of voltage-induced Ca2+ transients in viral-infected FDB muscle cells (loaded with 10 μM Fluo-4-AM). Time elapsed from the removal of extracellular Ca2+ is indicated. Changes in the transverse dimension of the confocal image are due to variations in fiber shape at different line scan positions. (B) Decline of VICR with time in 0 [Ca2+]o is averaged from multiple experiments (n = 5 for Ad-control, n = 7 for Ad-shRNA). Circles represent individual Ad-control fibers (black); triangles represent Ad-shRNA fibers (red). Normalized VICR with VICR at time 0 is replotted to demonstrate the depletion rate of SR Ca2+ stores (inset panel). (C) After field-stimulated depletion of SR Ca2+ content, 2 mM Ca2+ was restored to the extracellular solution. The recovery of VICR was measured 20 min later (n = 8 for Ad-control; n = 7 for Ad-shRNA). Increasing the recovery time to 35 min did not significantly influence the response in Ad-shRNA muscle fibers. Data are presented as the mean with error bars representing one standard deviation, p < 0.001.

References

    1. Dirksen, R. T. 2002. Bi-directional coupling between dihydropyridine receptors and ryanodine receptors. Front. Biosci. 7:d659–d670. - PubMed
    1. Ma, J., and Z. Pan. 2003. Junctional membrane structure and store operated calcium entry in muscle cells. Front. Biosci. 8:d242–d255. - PubMed
    1. Franzini-Armstrong, C., and A. O. Jorgensen. 1994. Structure and development of E-C coupling units in skeletal muscle. Annu. Rev. Physiol. 56:509–534. - PubMed
    1. Takeshima, H., S. Komazaki, M. Nishi, M. Iino, and K. Kangawa. 2000. Junctophilins: a novel family of junctional membrane complex proteins. Mol. Cell. 6:11–22. - PubMed
    1. Nishi, M., H. Sakagami, S. Komazaki, H. Kondo, and H. Takeshima. 2003. Coexpression of junctophilin type 3 and type 4 in brain. Brain Res. Mol. Brain Res. 118:102–110. - PubMed

Publication types