. 2006 Jun 1;90(11):4046-59.
doi: 10.1529/biophysj.105.077743. Epub 2006 Mar 24.

Interaction of transported drugs with the lipid bilayer and P-glycoprotein through a solvation exchange mechanism

Affiliations

Interaction of transported drugs with the lipid bilayer and P-glycoprotein through a solvation exchange mechanism

Hiroshi Omote et al. Biophys J. .

Abstract

Broad substrate specificity of human P-glycoprotein (ABCB1) is an essential feature of multidrug resistance. Transport substrates of P-glycoprotein are mostly hydrophobic and many of them have net positive charge. These compounds partition into the membrane. Utilizing the energy of ATP hydrolysis, P-glycoprotein is thought to take up substrates from the cytoplasmic leaflet of the plasma membrane and to transport them to the outside of the cell. We examined this model by molecular dynamics simulation of the lipid bilayer, in the presence of transport substrates together with an atomic resolution structural model of P-glycoprotein. Taken together with previous electron paramagnetic resonance studies, the results suggest that most transported drugs are concentrated near the surface zone of the inner leaflet of the plasma membrane. Here the drugs can easily diffuse laterally into the drug-binding site of P-glycoprotein through an open cleft. It was concluded that the initial high-affinity drug-binding site was located in the interfacial surface area of P-glycoprotein in contact with the membrane interface. Based on these results and our recent kinetic studies, a "solvation exchange" drug transport mechanism of P-glycoprotein is discussed. A molecular basis for the improved colchicine transport efficiency by the much-studied colchicine-resistance G185V mutant human P-glycoprotein is also provided.


Figures
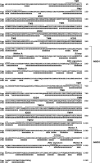
FIGURE 1
FIGURE 1
Location of structural elements and conserved motifs in the primary sequence of human P-glycoprotein. The primary sequence of human P-glycoprotein is shown with the PHD predicted secondary structure (37) where H indicates helical residues and E indicates β-strand residues. Locations of transmembrane residues (TM1–TM12) are indicated by ribbon helices and locations of intracellular domains are indicated by shaded bars (ICD1–ICD6) (based on Chang (38)). Conserved nucleotide binding domain (NBD) motifs Walker A, Q-loop, ABC signature, and Walker B are indicated by solid black bars.
FIGURE 2
FIGURE 2
Atomic detail homology and energy minimized model structure of human P-glycoprotein. This model is a refinement of our previous homology model (33). The crystal structure coordinates of V. cholera lipid A transporter MsbA (38) S. typhimurium histidine permease HisP (39) and human TAP1 (41) were used (see Materials and Methods). Atom conflicts were removed by simulated annealing and the structure was energy minimized. One rhodamine 123 molecule (illustrated by space-filling model) is shown in the putative high-affinity binding site of the N-terminal half-molecule. See text for further details. (A) A closed-structure conformation of the whole protein and bound drug showing discussed structural elements. (B) View of the nucleotide sites from the cytoplasm. (C) View of the TMs from outside the cell, illustrating the drug binding structures.
FIGURE 3
FIGURE 3
Chemical structures of drug molecules used in molecular dynamics simulations.
FIGURE 4
FIGURE 4
Snap shots from molecular dynamics simulations. Snapshots of deprotonated verapamil (A) and protonated verapamil (B) were taken at the end of 10 ns molecular dynamics simulations. Drugs are illustrated by large space-filling models, water molecules by small ball models and lipids by line models.
FIGURE 5
FIGURE 5
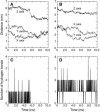
Trajectory and hydrogen bond formation of verapamil in the membrane bilayer. Molecular dynamics simulations of P-glycoprotein transport drugs entering a DPPC bilayer were performed as detailed in Materials and Methods. Centers of mass of deprotonated verapamil and protonated verapamil were calculated and plotted against the elapsed simulation time. Distances for each axis were measured from the corner of the simulation box. X and Y axes are parallel to the plane of the membrane and the Z axis is perpendicular to the lipid bilayer. The center of the lipid bilayer in the Z axis is 3.74 nm. (A) Illustrates the change in coordinate distances for deprotonated verapamil. (B) Illustrates the change in coordinate distances for protonated verapamil. Hydrogen bonds formed between verapamil and water and lipid headgroups were also determined during the simulation time course. Number of hydrogen bonds formed is plotted as a function of time for deprotonated verapamil (C) and protonated verapamil (D). In panel C, after 5.5 ns, deprotonated verapamil fully enters the hydrocarbon core of the bilayer and abolishes all hydrogen bonding from then on (zero hydrogen bonds formed).
FIGURE 6
FIGURE 6
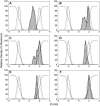
Distribution density profiles of drugs across the lipid bilayer. Distribution density profiles relative to maximum distribution values of drugs, water and lipid atoms were plotted against the Z axis position from the center of the membrane. Positive Z axis values represent distances from the center of the bilayer toward the cytoplasm whereas negative values are distances toward the outside of the cell. Averaged densities were taken from MD trajectories after reaching stable equilibrium positions (7–10 ns averaged). (A) Deprotonated verapamil; (B) protonated verapamil; (C) Hoechst 33342; (D) SL-verapamil (colchicine very similar, not shown); (E) uncharged rhodamine 123; (F) charged daunorubicin (charged rhodamine superimposable). Distribution density lines are: thick solid lines with hatched areas, drug; solid lines, water; dotted lines, phosphorous atoms of DPPC; dashed lines, nitrogen atoms of DPPC.
FIGURE 7
FIGURE 7
Postulated P-glycoprotein residues that contribute to initial drug binding. A structural model of human P-glycoprotein is shown based on homology modeling (Fig. 2). See Materials and Methods for modeling details. Amino terminal and carboxyl terminal halves of P-glycoprotein molecules are illustrated in left and right side panels, respectively. Both half-molecules are viewed parallel to the plane of the membrane from the center of the putative drug chamber side as illustrated by the schematic inset. A whole P-glycoprotein molecule can be assembled by rotating one of the two halves by 180° normal to the plane of the membrane and bringing the two halves together to form the putative drug binding chamber. The membrane zone is shown as green bands with a dotted line indicating the center of the bilayer. Polar and aromatic residues inside the chamber are illustrated by space filling models. Candidate residues that contribute to initial drug binding are labeled by arrows. Negatively charged residues have shaded labels. Structure illustrations were prepared by Molscript (89).
FIGURE 8
FIGURE 8
Surface potential distribution of modeled human P-glycoprotein. A molecular surface of modeled human P-glycoprotein showing the electrostatic potential distribution is shown in the same orientation as Fig. 7. The figure was prepared with WebLab ViewerPro (Accelrys, San Diego, CA) with red and blue indicating negative and positive charge, respectively.
FIGURE 9
FIGURE 9
Drug hydrogen bond formation correlates with P-glycoprotein drug transport activity. The log of experimentally determined intrinsic drug transport rates was plotted against the log of MD simulated time-averaged number of H-bonds formed between the drug and the lipids at equilibrium. For drug transport activity assays, pure human P-glycoprotein reconstituted in “mixed lipid” proteoliposomes was assayed at 35°C and pH 7.5 (see Materials and Methods section for details). The line plotted was a linear regression fit to the data excluding the colchicine interaction with wild-type (WT) P-glycoprotein (open symbol). The linear free energy relationship was characterized by a slope of −1.018, an intercept of 1.063, and an R2 value of 0.9814.
FIGURE 10
FIGURE 10
Solvation exchange mechanism of drug transport by P-glycoprotein. A postulated mechanism of drug transport by P-glycoprotein is illustrated. (A) A drug molecule is in equilibrium between the aqueous phase and the lipid bilayer. Due to hydrophobicity, drugs partition to the inner leaflet of the plasma membrane. Drugs maintain contact with water and lipid headgroups through polar interactions to the polar parts of the drug. (B) The drug molecule can laterally diffuse to the inside of the drug-binding chamber and bind to the drug-binding site. Part of the hydration shell of the drug is replaced by the polar residues in the intracellular domain helices (ICD helices) and the upper part of the drug-binding chamber. The hydrophobic part of the drug is adsorbed by hydrophobic residues in the chamber (hatched areas) through van der Waals interactions. (C) ATP hydrolysis closes the entry cleft and rotates helices located in the ICD and chamber domains and destroys electrostatic interactions and hydrogen bonds between the polar part of the drug and P-glycoprotein (dotted arrow). Loss of polar interactions that tether the polar part of the drug to the surface zone initiates flipping of drug (solid arrows). Hydrophilic residues scattered inside of the putative drug-binding chamber, and water molecules, may form transient hydrogen bonds to the drug aiding in the flipping process. (D) ATP hydrolysis also opens an exit through which water access is available. (E) Later favorable hydrophobic interactions to the drug are removed (dotted arrow) and more water enters the chamber. Drug is thus forcibly rehydrated and partitioned to the water phase allowing diffusion to the extracellular aqueous space (solid arrow). This large unfavorable utilization of energy is compensated by large favorable interactions formed in other parts of P-glycoprotein by the same helix rotating events. See text for further details.

Comment in

References

    1. Gottesman, M. M., and I. Pastan. 1993. Biochemistry of multidrug resistance mediated by the multidrug transporter. Annu. Rev. Biochem. 62:385–427. - PubMed
    1. Borst, P., and R. O. Elferink. 2002. Mammalian ABC transporters in health and disease. Annu. Rev. Biochem. 71:537–592. - PubMed
    1. Ambudkar, S. V., C. Kimchi-Sarfaty, Z. E. Sauna, and M. M. Gottesman. 2003. P-glycoprotein: from genomics to mechanism. Oncogene. 22:7468–7485. - PubMed
    1. Leslie, E. M., R. G. Deeley, and S. P. Cole. 2005. Multidrug resistance proteins: role of P-glycoprotein, MRP1, MRP2, and BCRP (ABCG2) in tissue defense. Toxicol. Appl. Pharmacol. 204:216–237. - PubMed
    1. Senior, A. E., M. K. Al-Shawi, and I. L. Urbatsch. 1995. ATP hydrolysis by multidrug-resistance protein from Chinese hamster ovary cells. J. Bioenerg. Biomembr. 27:31–36. - PubMed

Publication types

MeSH terms

Substances