. 2006 Apr 4;103(14):5602-7.
doi: 10.1073/pnas.0510213103. Epub 2006 Mar 24.

Costs and benefits of priming for defense in Arabidopsis

Affiliations

Costs and benefits of priming for defense in Arabidopsis

Marieke van Hulten et al. Proc Natl Acad Sci U S A. .

Abstract

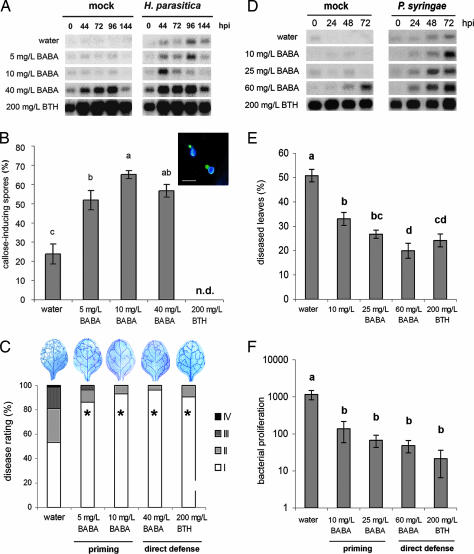
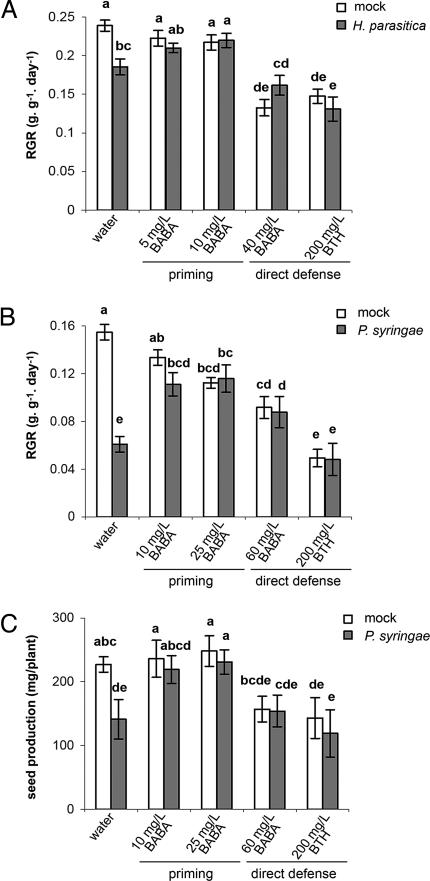
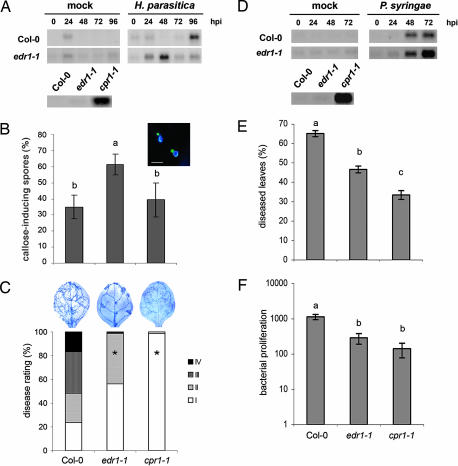
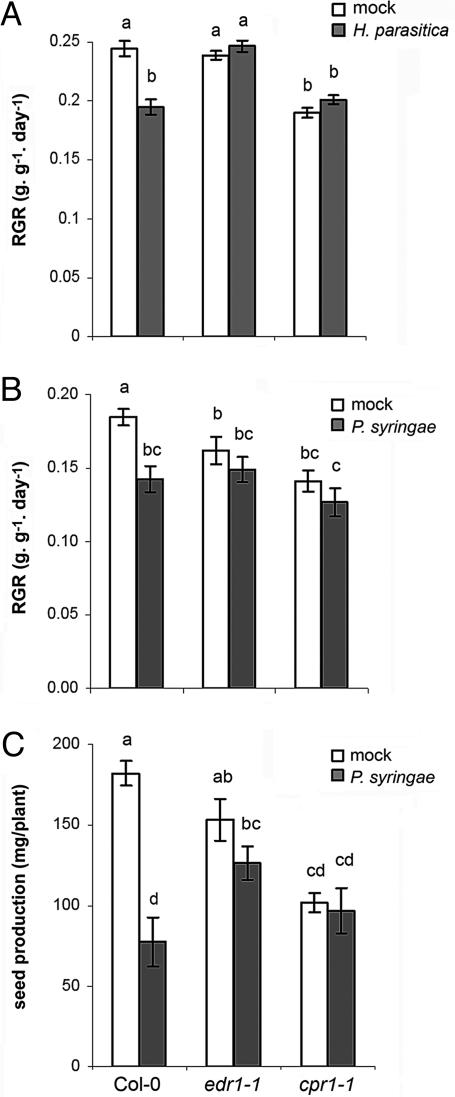
Induced resistance protects plants against a wide spectrum of diseases; however, it can also entail costs due to the allocation of resources or toxicity of defensive products. The cellular defense responses involved in induced resistance are either activated directly or primed for augmented expression upon pathogen attack. Priming for defense may combine the advantages of enhanced disease protection and low costs. In this study, we have compared the costs and benefits of priming to those of induced direct defense in Arabidopsis. In the absence of pathogen infection, chemical priming by low doses of beta-aminobutyric acid caused minor reductions in relative growth rate and had no effect on seed production, whereas induction of direct defense by high doses of beta-aminobutyric acid or benzothiadiazole strongly affected both fitness parameters. These costs were defense-related, because the salicylic acid-insensitive defense mutant npr1-1 remained unaffected by these treatments. Furthermore, the constitutive priming mutant edr1-1 displayed only slightly lower levels of fitness than wild-type plants and performed considerably better than the constitutively activated defense mutant cpr1-1. Hence, priming involves less fitness costs than induced direct defense. Upon infection by Pseudomonas syringae or Hyaloperonospora parasitica, priming conferred levels of disease protection that almost equaled the protection in benzothiadiazole-treated wild-type plants and cpr1 plants. Under these conditions, primed plants displayed significantly higher levels of fitness than noninduced plants and plants expressing chemically or cpr1-induced direct defense. Collectively, our results indicate that the benefits of priming-mediated resistance outweigh the costs in environments in which disease occurs.


Conflict of interest statement

Conflict of interest statement: No conflicts declared.

Figures

Fig. 1.
Fig. 1.
Chemical induction of priming and direct defense against H. parasitica WACO9 (AC) and P. syringae pv. tomato DC3000 (DF). Col-0 plants were soil-drenched with increasing concentrations of BABA or sprayed with BTH and pathogen-inoculated 2 days later. (A) PR-1 gene expression in 3-week-old control plants or BABA- or BTH-treated plants at different time points after inoculation. hpi, hours postinoculation. (B) Callose deposition 2 days after H. parasitica inoculation. (Inset) A representative example of H. parasitica spores triggering callose deposition in epidermal cells. (Scale bar, 20 μm.) n.d., not determined. (C) Induced resistance against H. parasitica at 8 days after inoculation. Asterisks indicate statistically different distributions of disease severity classes compared with the water control (χ2 test; α = 0.05). Colonization by the pathogen was visualized by lactophenol/trypan blue staining and light microscopy. (D) PR-1 gene expression in 6-week-old control plants or BABA- or BTH-treated plants at different time points after inoculation. (E) Induced resistance against P. syringae. Shown are means ± SEM (n = 15–20) of the percentage of leaves with symptoms at 3 days after inoculation. Different letters indicate statistically significant differences (least significant difference test; α = 0.05). (F) Growth of P. syringae over a 3-day time interval. Shown are means ± SD (n = 5–10). Different letters indicate statistically significant differences (least significant difference test; α = 0.05). All experiments shown were repeated with comparable results.
Fig. 2.
Fig. 2.
Costs and benefits of chemically induced priming and direct defense in the absence and presence of H. parasitica (A) or P. syringae (B and C). Plants were treated as described in the legend of Fig. 1. (A) RGR of mock- and H. parasitica-inoculated plants (3–4 weeks old) over the 12-day period from chemical treatment. Shown are mean values ± SEM (n = 8–12). (B) RGR of mock- and P. syringae-inoculated plants (6–7 weeks old) over the 12-day period from chemical treatment. (C) Seed production of mock- and P. syringae-inoculated plants. Shown are mean values ± SEM (n = 8–12) of the seed weight per plant. Different letters indicate statistically significant differences (least significant difference test; α = 0.05). All experiments shown were repeated with comparable results.
Fig. 3.
Fig. 3.
Effects of direct defense-inducing amounts of BABA and BTH on RGR (A) and seed production (B) in Col-0 and npr1-1. Six-week-old plants were soil-drenched with water or 60 mg/liter BABA or were sprayed with 200 mg/liter BTH. See the legend of Fig. 2 for further details. Asterisks indicate statistically significant differences compared with the water control (α = 0.05, Student's t test).
Fig. 4.
Fig. 4.
Priming in the edr1-1 mutant and constitutive direct defense in the cpr1-1 mutant against H. parasitica (AC) and P. syringae (DF). (A) PR-1 gene expression in 3-week-old plants at different time points after inoculation. hpi, hours postinoculation. (B) Callose deposition at 2 days after challenge with H. parasitica. (C) Induced resistance against H. parasitica 8 days after inoculation. (D) PR-1 gene expression in 6-week-old plants at different time points after inoculation. (E) Induced resistance against P. syringae. (F) Growth of P. syringae over a 3-day time interval. See the legend of Fig. 1 for details.
Fig. 5.
Fig. 5.
Costs and benefits of edr1-induced priming and cpr1-induced defense in the absence and presence of H. parasitica (A and B) and P. syringae (C). (A) RGR in 3- to 4-week-old plants over the 10-day period after mock or challenge inoculation with H. parasitica. Shown are mean RGR values ± SEM (n = 8–12). (B) RGR in 6- to 7-week-old plants over the 12-day period after mock or challenge inoculation with P. syringae. (C) Seed production by mock- and P. syringae-inoculated plants. Shown are mean values ± SEM (n = 8–12) of the seed weight per plant. See the legend of Fig. 2 for further details.

References

    1. Heil M. Curr. Opin. Plant. Biol. 2002;5:345–350. - PubMed
    1. Agrawal A. A., Strauss S. Y., Stout M. J. Evolution. 1999;53:1093–1104. - PubMed
    1. Baldwin I. T. Proc. Natl. Acad. Sci. USA. 1998;95:8113–8118. - PMC - PubMed
    1. Van Dam N. M., Baldwin I. T. Funct. Ecol. 2001;15:406–415.
    1. Agrawal A. A. Science. 1998;279:1201–1202. - PubMed

Publication types

Substances