

Elevated levels of cholesterol-rich lipid rafts in cancer cells are correlated with apoptosis sensitivity induced by cholesterol-depleting agents
- PMID: 16565487
- PMCID: PMC1606567
- DOI: 10.2353/ajpath.2006.050959
Elevated levels of cholesterol-rich lipid rafts in cancer cells are correlated with apoptosis sensitivity induced by cholesterol-depleting agents
Abstract
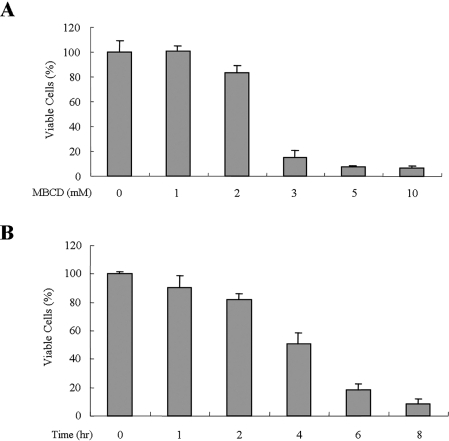
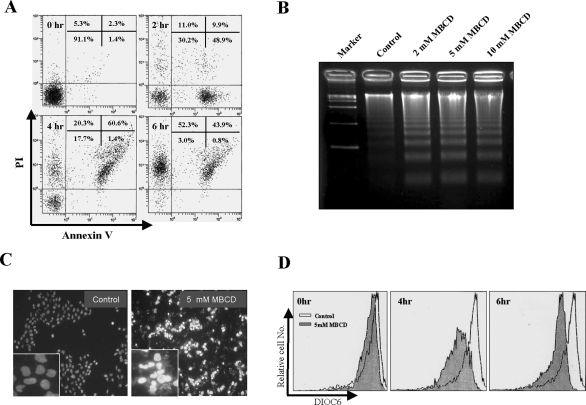
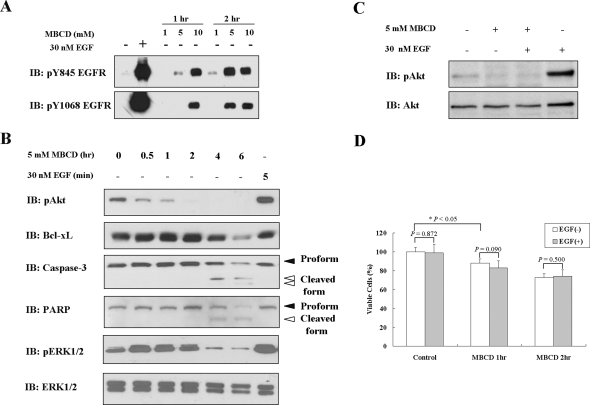
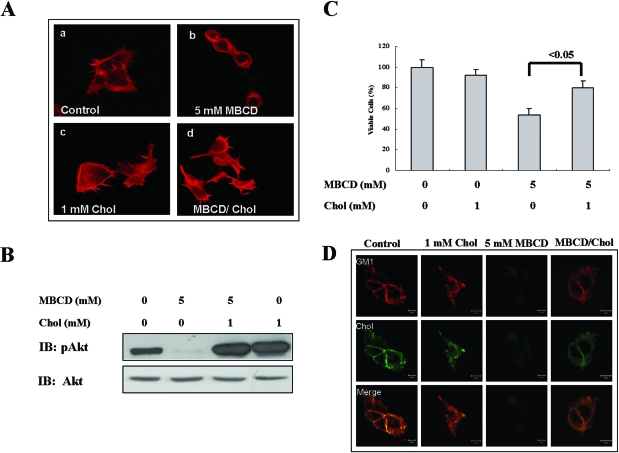
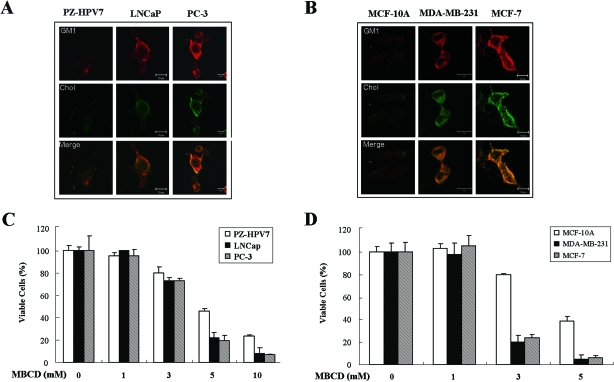
Lipid rafts/caveolae are membrane platforms for signaling molecules that regulate various cellular functions, including cell survival. To better understand the role of rafts in tumor progression and therapeutics, we investigated the effect of raft disruption on cell viability and compared raft levels in human cancer cell lines versus their normal counterparts. Here, we report that cholesterol depletion using methyl-beta cyclodextrin caused anoikis-like apoptosis, which in A431 cells involved decreased raft levels, Bcl-xL down-regulation, caspase-3 activation, and Akt inactivation regardless of epidermal growth factor receptor activation. Cholesterol repletion replenished rafts on the cell surface and restored Akt activation and cell viability. Moreover, the breast cancer and the prostate cancer cell lines contained more lipid rafts and were more sensitive to cholesterol depletion-induced cell death than their normal counterparts. These results indicate that cancer cells contain increased levels of rafts and suggest a potential use of raft-modulating agents as anti-cancer drugs.
Figures
Similar articles
-
Cholesterol level of lipid raft microdomains regulates apoptotic cell death in prostate cancer cells through EGFR-mediated Akt and ERK signal transduction.Prostate. 2007 Jul 1;67(10):1061-9. doi: 10.1002/pros.20593. Prostate. 2007. PMID: 17469127
-
Lipid raft cholesterol and genistein inhibit the cell viability of prostate cancer cells via the partial contribution of EGFR-Akt/p70S6k pathway and down-regulation of androgen receptor.Biochem Biophys Res Commun. 2010 Mar 5;393(2):319-24. doi: 10.1016/j.bbrc.2010.01.133. Epub 2010 Feb 6. Biochem Biophys Res Commun. 2010. PMID: 20138837
-
HIF-1 is induced via EGFR activation and mediates resistance to anoikis-like cell death under lipid rafts/caveolae-disrupting stress.Carcinogenesis. 2009 Dec;30(12):1997-2004. doi: 10.1093/carcin/bgp233. Carcinogenesis. 2009. PMID: 19789263
-
Lipid rafts as major platforms for signaling regulation in cancer.Adv Biol Regul. 2015 Jan;57:130-46. doi: 10.1016/j.jbior.2014.10.003. Epub 2014 Oct 27. Adv Biol Regul. 2015. PMID: 25465296 Review.
-
Lipid rafts as signaling hubs in cancer cell survival/death and invasion: implications in tumor progression and therapy: Thematic Review Series: Biology of Lipid Rafts.J Lipid Res. 2020 May;61(5):611-635. doi: 10.1194/jlr.TR119000439. Epub 2020 Nov 7. J Lipid Res. 2020. PMID: 33715811 Free PMC article. Review.
Cited by
-
Statin Use in Prostate Cancer: An Update.Nutr Metab Insights. 2016 Jul 14;9:43-50. doi: 10.4137/NMI.S38362. eCollection 2016. Nutr Metab Insights. 2016. PMID: 27441003 Free PMC article. Review.
-
Human growth factor-mediated signalling through lipid rafts regulates stem cell proliferation, development and survival of Schistosoma mansoni.Open Biol. 2024 Jan;14(1):230262. doi: 10.1098/rsob.230262. Epub 2024 Jan 10. Open Biol. 2024. PMID: 38195062 Free PMC article.
-
Tumor Tissue Oxidative Stress Changes and Na, K-ATPase Evaluation in Head and Neck Squamous Cell Carcinoma.J Membr Biol. 2021 Dec;254(5-6):475-486. doi: 10.1007/s00232-021-00185-y. Epub 2021 Jun 8. J Membr Biol. 2021. PMID: 34104985
-
B3GALT4 remodels the tumor microenvironment through GD2-mediated lipid raft formation and the c-met/AKT/mTOR/IRF-1 axis in neuroblastoma.J Exp Clin Cancer Res. 2022 Oct 25;41(1):314. doi: 10.1186/s13046-022-02523-x. J Exp Clin Cancer Res. 2022. PMID: 36284313 Free PMC article.
-
The tumor suppressor TERE1 (UBIAD1) prenyltransferase regulates the elevated cholesterol phenotype in castration resistant prostate cancer by controlling a program of ligand dependent SXR target genes.Oncotarget. 2013 Jul;4(7):1075-92. doi: 10.18632/oncotarget.1103. Oncotarget. 2013. PMID: 23919967 Free PMC article.
References
-
- Galbiati F, Razani B, Lisanti MP. Emerging themes in lipid rafts and caveolae. Cell. 2001;106:403–411. - PubMed
-
- Waugh MG, Minogue S, Anderson JS, dos Santos M, Hsuan JJ. Signalling and non-caveolar rafts. Biochem Soc Trans. 2001;29:509–511. - PubMed
-
- Harder T. Lipid raft domains and protein networks in T-cell receptor signal transduction. Curr Opin Immunol. 2004;16:353–359. - PubMed
-
- Muppidi JR, Siegel RM. Ligand-independent redistribution of Fas (CD95) into lipid rafts mediates clonotypic T cell death. Nat Immunol. 2004;5:182–189. - PubMed
-
- Gniadecki R. Depletion of membrane cholesterol causes ligand-independent activation of Fas and apoptosis. Biochem Biophys Res Commun. 2004;320:165–169. - PubMed
Publication types
MeSH terms
Substances
LinkOut - more resources
Full Text Sources
Other Literature Sources
Medical
Research Materials
