. 2006 Apr;168(4):1134-47.
doi: 10.2353/ajpath.2006.050686.

Activation of the canonical wingless/T-cell factor signaling pathway promotes invasive differentiation of human trophoblast

Affiliations

Activation of the canonical wingless/T-cell factor signaling pathway promotes invasive differentiation of human trophoblast

Jürgen Pollheimer et al. Am J Pathol. 2006 Apr.

Abstract

The molecular mechanisms governing invasive differentiation of human trophoblasts remain largely elusive. Here, we investigated the role of Wnt-beta-catenin-T-cell factor (TCF) signaling in this process. Reverse transcriptase-polymerase chain reaction and Western blot analyses demonstrated expression of Wnt ligands, frizzled receptors, LRP-6, and TCF-3/4 transcription factors in total placenta and different trophoblast cell models. Immunohistochemistry of placental tissues and differentiating villous explant cultures showed that expression of TCF-3/4 strongly increased in invading trophoblasts. Some of these cells also accumulated dephosphorylated beta-catenin in the nucleus. Wnt3A treatment of primary cytotrophoblasts and SGHPL-5 cells induced activity of TCF-luciferase reporters. Accordingly, the ligand provoked interaction of TCF-3/4 with beta-catenin as assessed in electrophoretic mobility shift assays (EMSAs) and up-regulation of Wnt/TCF target genes as observed by Western blot analyses. Wnt3A stimulated trophoblast migration and invasion through Matrigel, which could be blocked by addition of Dickkopf-1, mediating in-hibition of canonical Wnt signaling. Dickkopf-1 also reduced basal migration, invasion, and proliferation of cytotrophoblasts, suggesting expression of endogenous Wnt ligand(s). Immunohistochemistry revealed that the percentage of extravillous trophoblasts containing nuclear beta-catenin was significantly higher in placentas of complete hydatidiform mole pregnancies as compared to normal placentas. Thus, canonical Wnt signaling may promote invasive trophoblast differentiation, and exaggerated activation of the path-way could contribute to trophoblastic hyperplasia and local invasion.


Figures
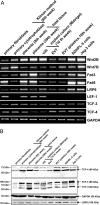
Figure 1
Figure 1
Analyses of components of the Wnt signaling pathway in different placental tissues and primary cell cultures. Extraction of mRNA and protein from cells and tissues was performed as described in Materials and Methods. Representative examples of experiments performed with at least three different placental tissues or cell preparations are shown. A: Semiquantitative RT-PCR analyses. Detection of GAPDH cDNA fragment was used as a control of equal mRNA quantities. Primer sequences, cycle numbers, and length of PCR products are mentioned in Materials and Methods. B: Western blot analyses. Separation of proteins and immunodetection using antibodies specifically recognizing LRP-6 (180 kd), TCF-4 (66 kd), or both TCF-3 and TCF-4 (66 kd, 80 kd) were performed as described in Materials and Methods. After stripping of filters, antibodies against GAPDH (36 kd) were used to monitor protein loading. LRP-6, TCF-3, TCF-4, GAPDH signals, and marker bands (left) are indicated; unspecific signals are depicted by open circles.
Figure 2
Figure 2
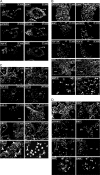
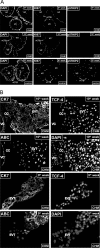
Immunohistochemical analyses of LEF-1/TCF and β-catenin localization in placental tissues and villous explant cultures. Serial sections were immunostained with different antibodies, counterstained with DAPI, and analyzed by fluorescence microscopy as described above. Representative placental sections prepared from the 6th week (n = 5), 8th to 12th weeks (n = 14), and 18th to 22nd weeks (n = 12) of pregnancy and from first trimester villous explant cultures (8th week, n = 5; 10th week, n = 3) are shown. Ci, cell island; vCTB, villous cytotrophoblast; CC, cell column; EVT, extravillous trophoblast; VC, villous core; ABC, active β-catenin. Arrowheads indicate representative cytotrophoblasts expressing nuclear ABC. A: Villus of a 6-week placenta. B: Eight- and ten-week placentas. The inset depicted in ABC-1 is shown at higher magnification below (ABC-2). C: Midgestation anchoring villi attached to the decidua. Specific antibodies are indicated on the left, the corresponding DAPI counterstains are shown at the right. The inset depicted in ABC-1 is shown at a higher magnification in ABC-2 (digitally zoomed). D: Differentiating villous explant (10th week) seeded on Matrigel for 24 hours. Pictures were taken at a 400-fold and 1000-fold (ABC) magnification. Original magnifications: ×400 [A, B (week 8)]; ×200 [B (week 10), C]; ×1000 (ABC).
Figure 3
Figure 3
Analyses of formation and activity of β-catenin/TCF complexes. SGHPL-5 cells or first trimester cytotrophoblasts were stimulated with Wnt3A (100 ng/ml) for 14 hours. A: EMSA of Wnt3A-treated SGHPL-5 cells. Nuclear extraction and EMSA of controls and Wnt3A-stimulated cells were performed as described in Materials and Methods. Specific DNA-binding complexes containing TCF-3/4 are indicated; bands supershifted by different antibodies (AB) are indicated by asterisks. Open circles mark unspecific signals. B: Luciferase assays of SGHPL-5 cells after co-transfection of either TOP-FLASH or FOP-FLASH and CMV-βGal plasmids. After Wnt3A stimulation luciferase activity was determined in protein extracts and normalized to β-Gal activity as described above. For comparison, values of FOP-FLASH (unstimulated) were arbitrarily set to 100% in each experiment. Bars represent mean values of six independent transfections of three different cultures, error bars indicate SD. *P < 0.05. C: Wnt-dependent accumulation of ABC in nuclei of primary cytotrophoblasts. Cells were seeded on chamber slides and treated with Wnt3A, Wnt3A and Dkk1 (1 μg/ml), or Dkk1 alone, fixed, and immunocytochemically stained with ABC antibodies and DAPI. The ratio of ABC-positive nuclei versus DAPI of each condition was determined on digital pictures using αEaserFC software. Eight chamber slides in parallel (each 100 to 150 nuclei) of two different Kliman preparations were counted. D: Luciferase assay of primary cytotrophoblasts. Luciferase assay and normalization of values was performed as described above. Mean values were calculated from four independent transfections of two different preparations. *P < 0.05.
Figure 4
Figure 4
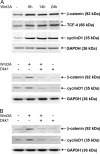
Western blot analyses of canonical Wnt/β-catenin target genes. Preparation of protein lysates, separation, and immunodetection using antibodies specifically recognizing TCF-4 (66 kd) β-catenin (92 kd), or cyclin D1 (35 kd) were performed as described in Materials and Methods. After stripping of filters, antibodies against GAPDH (36 kd) were used to evaluate protein loading. Signals at 24 hours of Wnt3A stimulation were quantitated using αEaserFC software and normalized to GAPDH signals. Unspecific signal is marked by open circle. A: Protein expression in SGHPL-5 cells after 6, 14, and 24 hours of Wnt3A stimulation (100 ng/ml). For evaluation of canonical Wnt signaling, cells were stimulated for 24 hours in the absence or presence of Wnt3A and/or Dkk1 (1 μg/ml). B: Protein expression in primary cytotrophoblasts after 24 hours of Wnt3A treatment in the absence or presence of Dkk1.
Figure 5
Figure 5
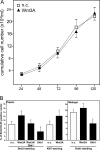
Proliferation of SGHPL-5 cells and primary cytotrophoblasts in the presence of Wnt3A. A: Determinations of cumulative cell numbers of Wnt3A-treated and untreated cultures were performed as described in Materials and Methods. Mean values ± SD are derived from two different experiments performed in duplicates. B: Proliferation of first trimester cytotrophoblasts. Cells were treated for 24 hours in the absence or presence of Wnt3A (100 ng/ml) and/or Dkk1 (1 μg/ml). BrdU labeling (24 hours) and Ki-67 staining were performed as described in Materials and Methods. The percentage of BrdU-labeled and Ki-67-labeled nuclei is depicted. Mean values ± SD are derived from two different experiments performed in triplicates. *P < 0.05.
Figure 6
Figure 6
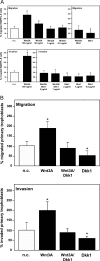
Migration and invasion assays of trophoblastic SGHPL-5 cells and purified first trimester cytotrophoblasts. Transwell migration and invasion assays through Matrigel were performed as described above. Cells at the underside of the filters were digitally counted and analyzed using imaging software. Wnt3A and Dkk-1 were added at 100 ng/ml and 1 μg/ml, respectively, if not indicated otherwise. Values of untreated cultures (n.c., negative control) were arbitrarily set at 100%. *P < 0.005. A: Migration and invasion of SGHPL-5 cells. Bars represent mean values of six (migration) and four (invasion) different experiments, respectively, performed in duplicates, error bars indicate SD. B: Migration and invasion of primary cytotrophoblasts. Bars represent mean values of two (migration) and three (invasion) different experiments performed in duplicates, error bars indicate SD.
Figure 7
Figure 7
Immunohistochemical analyses of normal and CHM placentas. Placental tissues of 13 paraffin-embedded CHMs (between the 7th and 14th weeks of gestation) and 9 age-matched controls (between the 8th and 12th weeks of gestation) were stained with different antibodies, counterstained with DAPI, and analyzed by fluorescence microscopy as described in Materials and Methods. A: CHMs were stained with antibodies against p57KIP2, Ki-67, and cytokeratin 7. Two representative examples of villous CHM tissue (8th and 10th weeks of pregnancy), lacking p57KIP2 expression in villous cytotrophoblasts, and a normal 8-week placenta (control) are shown. B: Serial sections of two representative CHMs (9th and 10th weeks of gestation). VC, villous core; EVT, extravillous trophoblast; CC, cell column. Note the abundance of extravillous trophoblasts lacking membrane-bound ABC. CK7, cytokeratin 7; ABC, active β-catenin. For statistical evaluation, the ratio of nuclear ABC versus DAPI was counted in areas containing extravillous trophoblasts/cell columns. In total 1706 and 1415 nuclei of extravillous trophoblasts of CHMs (11 placentas) and normal tissues (9 placentas), respectively, were evaluated. Original magnifications: ×200 (A); ×400 (B).

Similar articles

Cited by

References

    1. Pijnenborg R, Bland JM, Robertson WB, Brosens I. Uteroplacental arterial changes related to interstitial trophoblast migration in early human pregnancy. Placenta. 1983;4:397–413. - PubMed
    1. Zhou Y, Fisher SJ, Janatpour M, Genbacev O, Dejana E, Wheelock M, Damsky CH. Human cytotrophoblasts adopt a vascular phenotype as they differentiate. A strategy for successful endovascular invasion? J Clin Invest. 1997;99:2139–2151. - PMC - PubMed
    1. Librach CL, Werb Z, Fitzgerald ML, Chiu K, Corwin NM, Esteves RA, Grobelny D, Galardy R, Damsky CH, Fisher SJ. 92-kD type IV collagenase mediates invasion of human cytotrophoblasts. J Cell Biol. 1991;113:437–449. - PMC - PubMed
    1. Damsky CH, Fitzgerald ML, Fisher SJ. Distribution patterns of extracellular matrix components and adhesion receptors are intricately modulated during first trimester cytotrophoblast differentiation along the invasive pathway, in vivo. J Clin Invest. 1992;89:210–222. - PMC - PubMed
    1. Vicovac L, Jones CJ, Aplin JD. Trophoblast differentiation during formation of anchoring villi in a model of the early human placenta in vitro. Placenta. 1995;16:41–56. - PubMed

Publication types

MeSH terms

LinkOut - more resources