. 2006 Apr;168(4):1354-64.
doi: 10.2353/ajpath.2006.050871.

A novel aspartic proteinase-like gene expressed in stratified epithelia and squamous cell carcinoma of the skin

Affiliations

A novel aspartic proteinase-like gene expressed in stratified epithelia and squamous cell carcinoma of the skin

Verena Rhiemeier et al. Am J Pathol. 2006 Apr.

Abstract

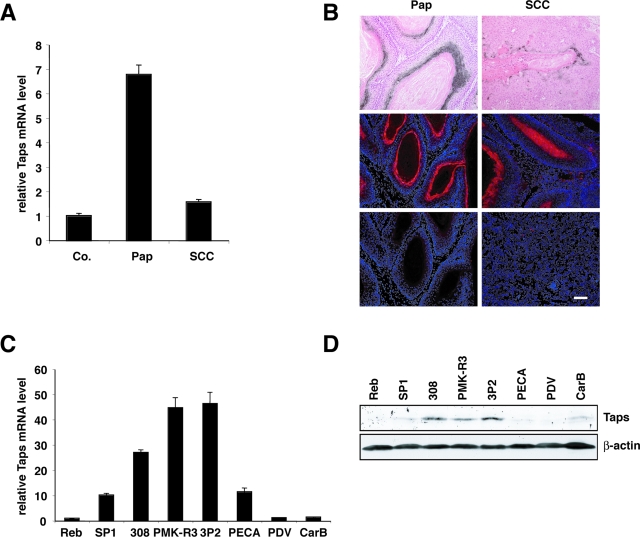
Homeostasis of stratified epithelia, such as the epidermis of the skin, is a sophisticated process that represents a tightly controlled balance between proliferation and differentiation. Alterations of this balance are associated with common human diseases including cancer. Here, we report the cloning of a novel cDNA sequence, from mouse back skin, that is induced by the phorbol ester 12-O-tetradecanoylphorbol-13-acetate (TPA) and codes for a hitherto unknown aspartic proteinase-like protein (Taps). Taps represents a potential AP-1 target gene because TPA-induced expression in epidermal keratinocytes critically depends on c-Fos, and co-treatment with dexamethasone, a potent inhibitor of AP-1-mediated gene regulation, resulted in impaired activation of Taps expression. Taps mRNA and protein are restricted to stratified epithelia in mouse embryos and adult tissues, implicating a crucial role for this aspartic proteinase-like gene in differentiation and homeostasis of multilayered epithelia. During chemically induced carcinogenesis, transient elevation of Taps mRNA and protein levels was detected in benign skin tumors. However, its expression is negatively associated with dedifferentiation and malignant progression in squamous cell carcinomas of the skin. Similar expression was observed in squamous skin tumors of patients, suggesting that detection of Taps levels represents a novel strategy to discriminate the progression state of squamous skin cancers.


Figures

Figure 1
Figure 1
Taps cDNA encodes a novel aspartic proteinase-like protein. A: Sequence of mouse Taps cDNA including the ORF of 1020 nucleotides coding for a protein of 339 amino acids. The start and stop codon are indicated as bold letters and the motif typical for retroviral aspartic proteinases (amino acids 207 to 218) is shown in bold italic letters. Underlined is the sequence cloned by the suppression subtractive hybridization approach. B: Schematic drawing of the expression plasmid used for transient transfection of HeLa cells. The Taps ORF fused to a Myc-His Tag was cloned in an expression plasmid sharing the cytomegalovirus promoter (CMV) and a polyadenylation signal (pA). D212N indicates the introduction of a point mutation resulting in impaired proteolytic activity of Taps protein (DNTaps). C: HeLa cells were transfected with either the expression plasmid encoding the wild-type (Taps) or mutated protein (DNTaps), and the parental pcDNA3.1(C) vector as a negative control. Tagged Taps protein was enriched from cell extracts and supernatants of transfected cells by incubation with TALON resin and analyzed by Western immunoblot using the polyclonal anti-Taps antibody. The arrow highlights the product of autoproteolytic activity.
Figure 2
Figure 2
Expression of Taps mRNA in embryonic tissues. In situ hybridization with a 35S-labeled anti-sense probe was performed on mouse embryonic sections on day E16.5 (left). The 35S-labeled sense probe served as control for specificity of the signals (right). Images were counterstained with H&E and were done with dark-field (A, B, E, F) or bright-field (C, D, G, H) microscopy. Scale bars = 100 μm (dark field); 25 μm (bright field).
Figure 3
Figure 3
Expression of Taps mRNA and protein in adult mouse tissues. In situ hybridization with a 35S-labeled anti-sense probe (black signal in A, B, E, and F) and IF analysis with an antibody specific for Taps in combination with a Cy3-labeled secondary antibody (red signal in C, D, G, and H) revealed Taps expression in stratified epithelia of tongue (A, C), esophagus (B, D), and forestomach (E, G). No expression was observed in simple epithelia such as colon (F, H). Sections were counterstained with H&E or H33342 (blue signal) for counterstaining of the nuclei. Images were taken with bright-field microscopy (A, B, E, and F) or immunofluorescence microscopy (C, D, G, and H). Scale bar = 100 μm.
Figure 4
Figure 4
Kinetics of TPA-induced Taps expression in mouse back skin. Mouse back skin was prepared at the indicated time points after TPA application and was either paraformaldehyde-fixed and embedded in paraffin or was used for total RNA isolation. A: Taps mRNA expression was determined by Northern blot analysis using a radioactive labeled probe specific for mouse Taps. Hybridization of the same blot with an 18S-rRNA-specific probe served as a control for equal loading and quality of the RNA. B: Indirect immunofluorescence analysis was performed on 6-μm sections using a rabbit polyclonal antibody specific for Taps protein (see Supplemental Figure S3 at http://ajp.amjpathol.org/). Staining was visualized with a Cy3-labeled secondary antibody (red signal) and H33342 (blue signal) was used for counterstaining of the nuclei. Images were taken by immunofluorescence microscopy. Scale bars = 100 μm (large images); 25 μm (insets).
Figure 5
Figure 5
c-Fos is indispensable for TPA-induced Taps expression. Back skin of wild-type (wt) and fos-deficient mice (fos−/−) was treated with acetone (Co.), TPA, or TPA and dexamethasone (T+D). Animals were sacrificed 6 hours after treatment and skin samples were used for total RNA isolation and Northern blot analysis as described in Figure 4A (A) or were used for skin sections and IF analysis as described in Figure 4B. Images were taken by immunofluorescence microscopy. Scale bar = 50 μm.
Figure 6
Figure 6
Expression of Taps during multistage skin carcinogenesis. Mouse back skin (Co.), benign (Pap), and malignant (SCC) tumor samples derived from the protocol of chemically induced carcinogenesis were used for total RNA isolation and cDNA synthesis. A: Quantitative RT-PCR was performed with Hprt as internal control and relative expression of control skin was set to one. Bars represent mean values ± SEM of an experiment that was done in triplicate. B:In situ hybridization with a 35S-labeled anti-sense probe (black signal, top) and IF analysis with an antibody specific for Taps on papilloma and a well differentiated SCC (red signal, middle) as well as on a dedifferentiated malignant tumor (bottom right). As a control a benign tumor was incubated with the second antibody only (bottom left). Sections were counterstained with H&E or with H33342 (blue signal) for counterstaining of the nuclei. The 35S-labeled sense probe served as a control for specificity of signals (data not shown). Images were taken by bright-field or immunofluorescence microscopy. C and D: Total RNA and cell extracts were prepared from several mouse keratinocyte cell lines characterized by their potential to form benign or malignant tumors after subcutaneous injection in nude mice. RQ-PCR was performed as described in A and bars represent mean values ± SEM of an experiment that was done in triplicate. Western immunoblot using the rabbit polyclonal anti-Taps antibody was done to demonstrate protein expression in these cell lines. Incubation of the same blot with the polyclonal anti-β-actin antibody served as a control for quantity and quality of the protein extracts. Scale bar = 100 μm.
Figure 7
Figure 7
Expression of Taps protein in human skin tumors. Indirect IF analysis with the polyclonal anti-Taps antibody revealed Taps expression in the stratum granulosum of normal skin adjacent to the tumor tissue (A), in a keratoacanthoma (B), and in a SCC with cornified inclusions (C), but not in a dedifferentiated SCC (D). Staining was visualized with an Alexa 488-labeled secondary antibody (green signal) and H33342 (blue signal) was used for counterstaining of the nuclei. Images were taken by immunofluorescence microscopy. Scale bar = 100 μm.
Figure 8-6822
Figure 8-6822
Expression of Taps protein in human skin lesions. Indirect IF analysis with the polyclonal anti-Taps antibody revealed expression of Taps protein (red signal) in the stratum granulosum in various skin lesions like psoriasis (B), lichen ruber (D), eczema (F), and in actinic keratosis (H). Nuclei were counterstained with H33342 (blue signal). IF analysis was performed as described in Figure 4B and the corresponding H&E-stained images (A, C, E, G) demonstrate lower magnification of the respective immunofluorescence images. The black rectangles within the images depict the area shown in the immunofluorescence analysis. Scale bars = 100 μm (H&E); 50 μm (IF).

Similar articles

Cited by

References

    1. Presland RB, Jurevic RJ. Making sense of the epithelial barrier: what molecular biology and genetics tell us about the functions of oral mucosal and epidermal tissues. J Dent Educ. 2002;66:564–574. - PubMed
    1. Fuchs E, Raghavan S. Getting under the skin of epidermal morphogenesis. Nat Rev Genet. 2002;3:199–209. - PubMed
    1. Koster MI, Roop DR. Genetic pathways required for epidermal morphogenesis. Eur J Cell Biol. 2004;83:625–629. - PubMed
    1. Candi E, Schmidt R, Melino G. The cornified envelope: a model of cell death in the skin. Nat Rev Mol Cell Biol. 2005;6:328–340. - PubMed
    1. Zeeuwen PL. Epidermal differentiation: the role of proteases and their inhibitors. Eur J Cell Biol. 2004;83:761–773. - PubMed

Publication types

MeSH terms