Comparative Study
. 2006 May 20;496(3):289-302.
doi: 10.1002/cne.20931.

Immunolocalization of the Ca2+-activated K+ channel Slo1 in axons and nerve terminals of mammalian brain and cultured neurons

Affiliations
Comparative Study

Immunolocalization of the Ca2+-activated K+ channel Slo1 in axons and nerve terminals of mammalian brain and cultured neurons

Hiroaki Misonou et al. J Comp Neurol. .

Abstract

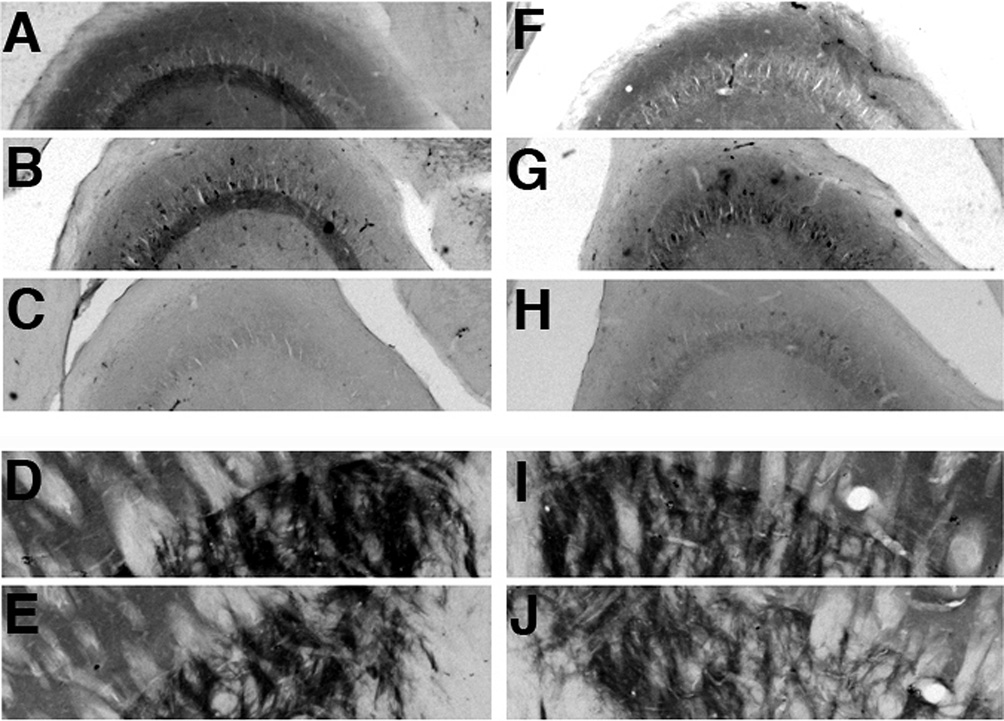
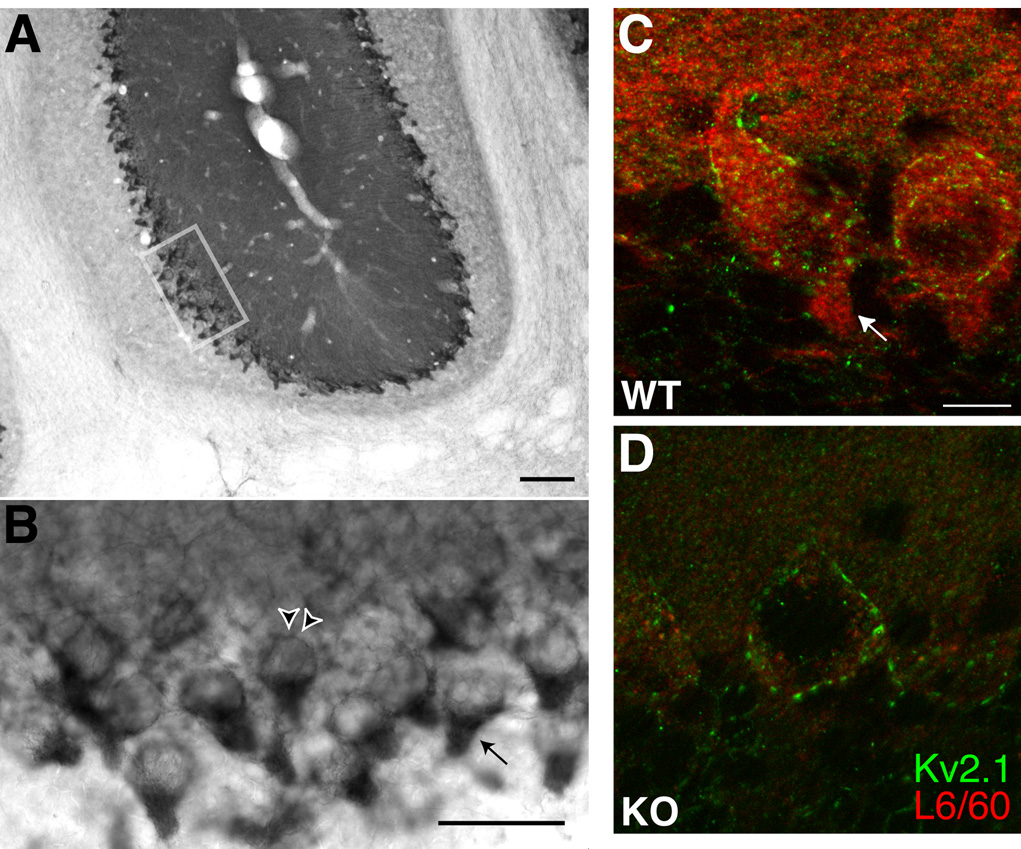
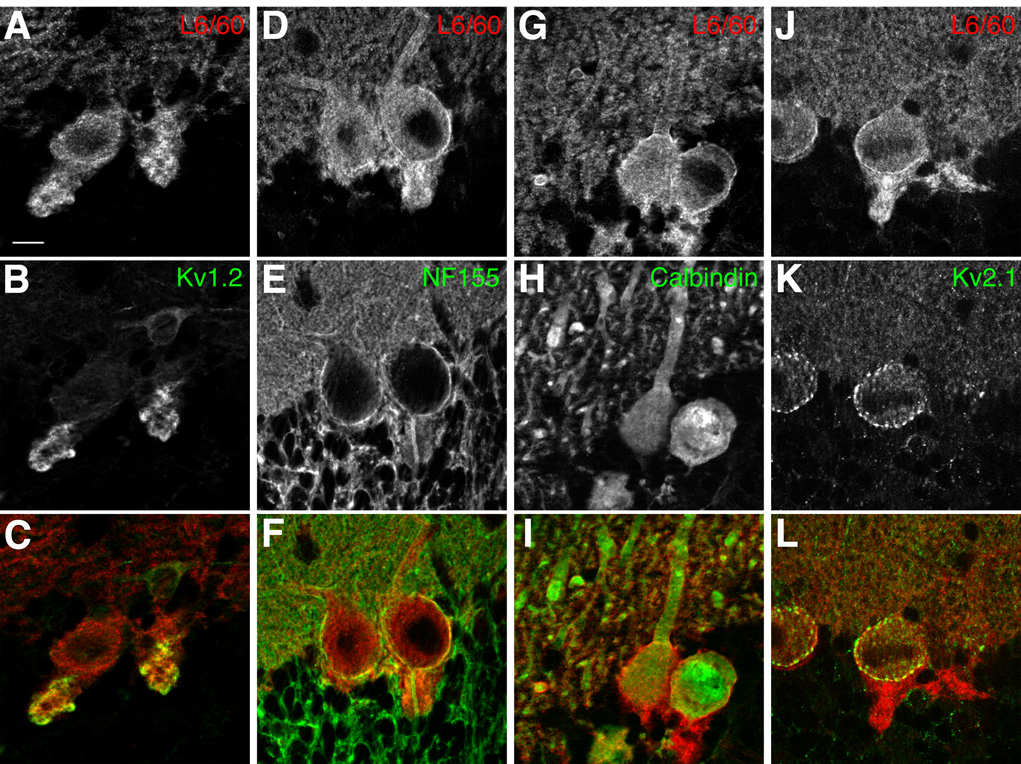
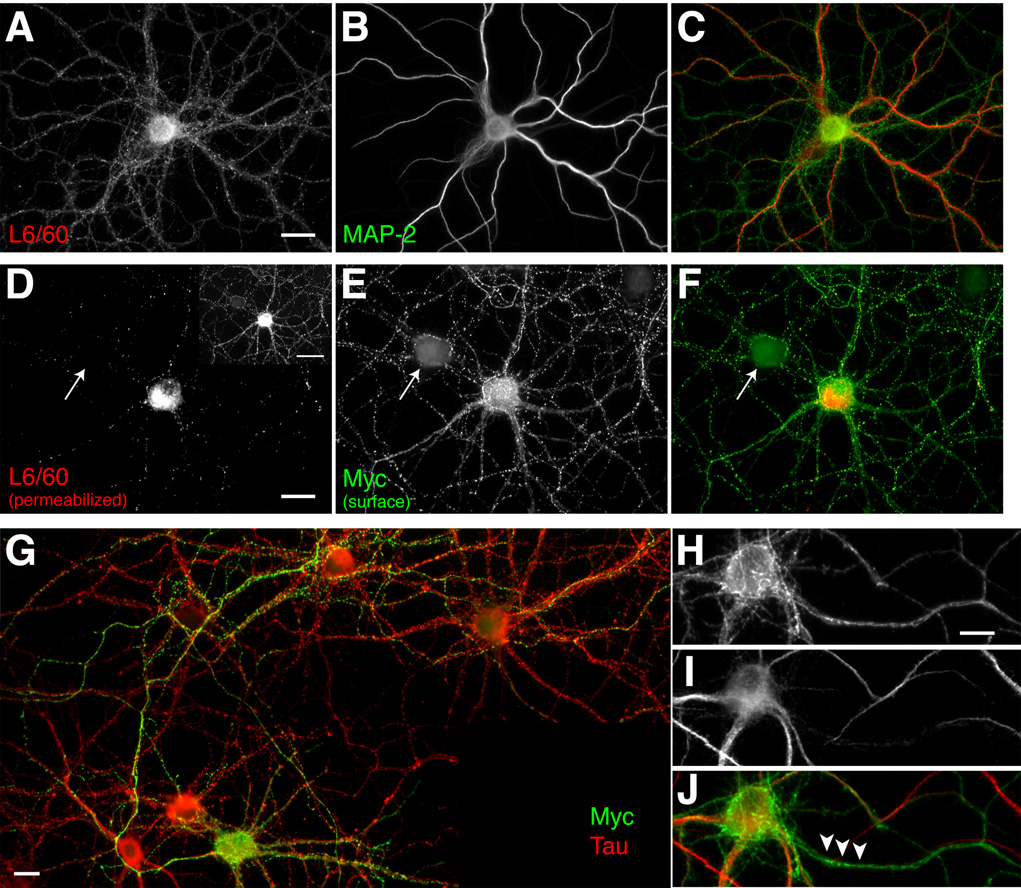
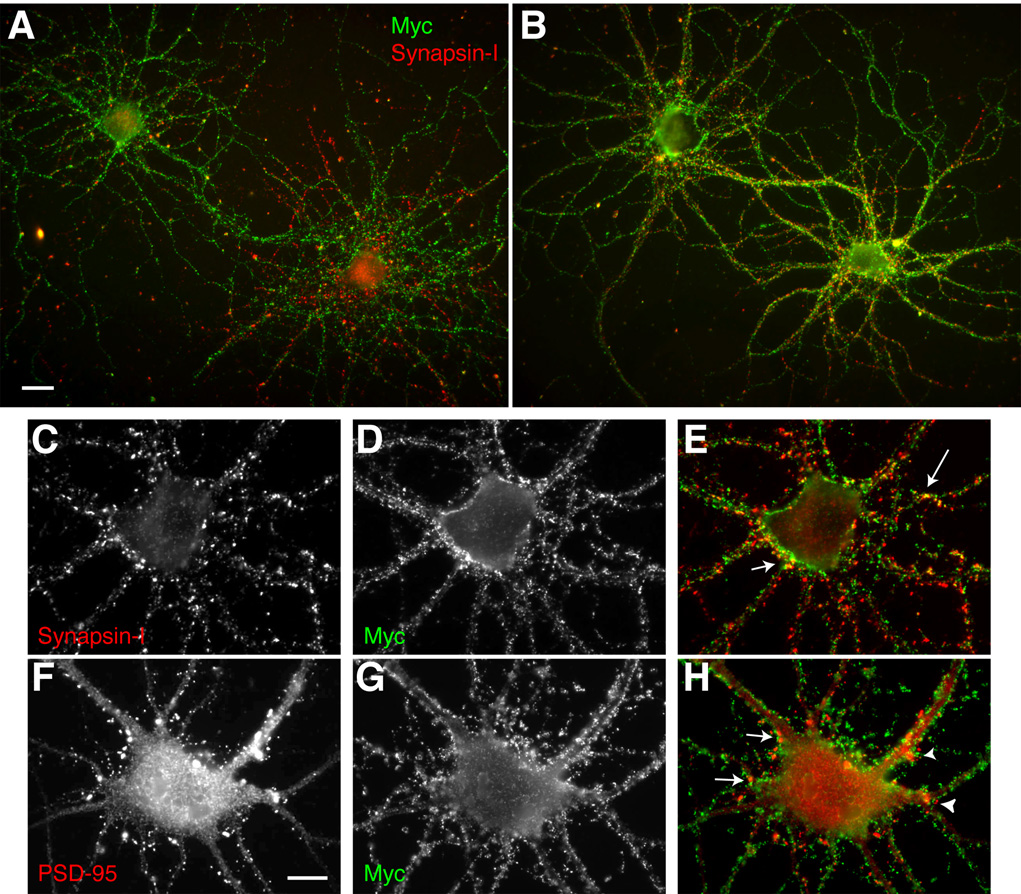
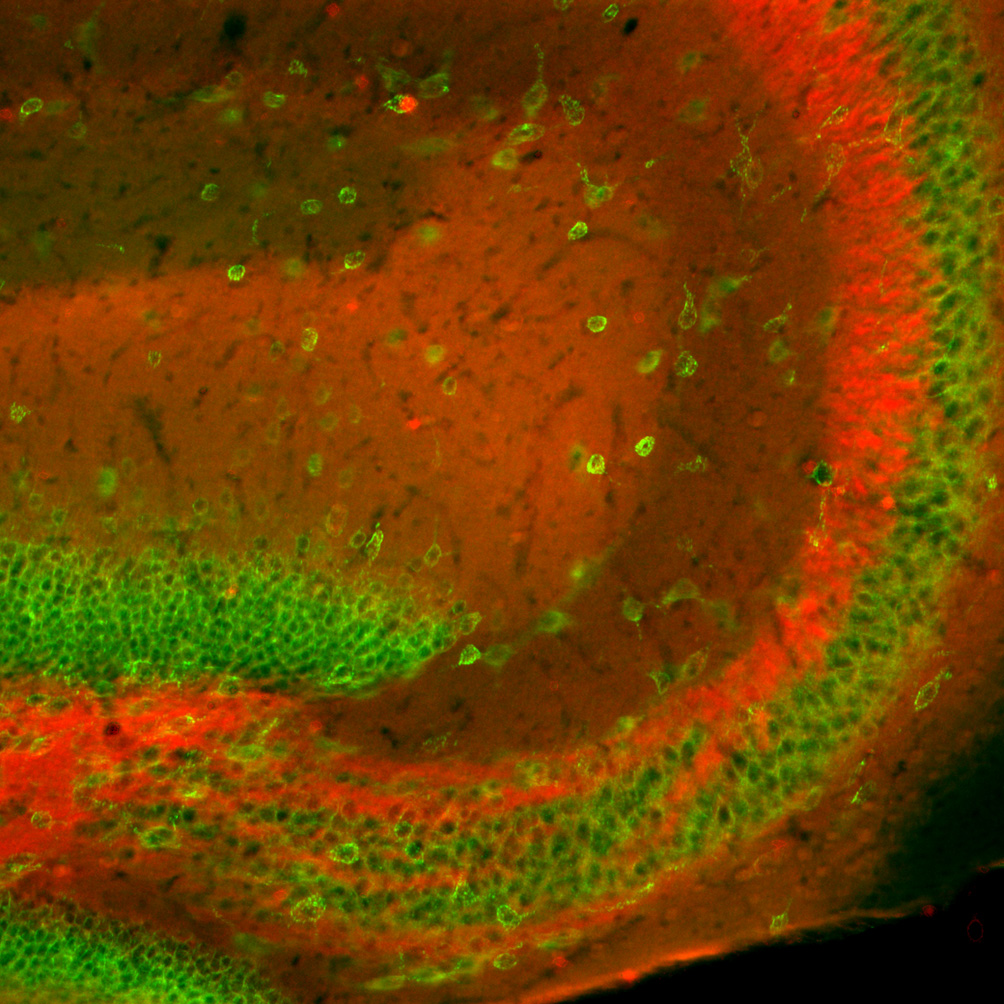
Ca(2+)-activated voltage-dependent K(+) channels (Slo1, KCa1.1, Maxi-K, or BK channel) play a crucial role in controlling neuronal signaling by coupling channel activity to both membrane depolarization and intracellular Ca(2+) signaling. In mammalian brain, immunolabeling experiments have shown staining for Slo1 channels predominantly localized to axons and presynaptic terminals of neurons. We have developed anti-Slo1 mouse monoclonal antibodies that have been extensively characterized for specificity of staining against recombinant Slo1 in heterologous cells, and native Slo1 in mammalian brain, and definitively by the lack of detectable immunoreactivity against brain samples from Slo1 knockout mice. Here we provide precise immunolocalization of Slo1 in rat brain with one of these monoclonal antibodies and show that Slo1 is accumulated in axons and synaptic terminal zones associated with glutamatergic synapses in hippocampus and GABAergic synapses in cerebellum. By using cultured hippocampal pyramidal neurons as a model system, we show that heterologously expressed Slo1 is initially targeted to the axonal surface membrane, and with further development in culture, become localized in presynaptic terminals. These studies provide new insights into the polarized localization of Slo1 channels in mammalian central neurons and provide further evidence for a key role in regulating neurotransmitter release in glutamatergic and GABAergic terminals.


Figures

Fig. 1
Fig. 1. Specificity of the anti-Slo1 mAb L6/60
A, immunoblot analysis of brain membrane fractions from adult rats, and wild-type and Slo1-deficient mice. Proteins were fractionated on 7.5% SDS-PAGE and transferred to nitrocellulose membranes and probed with mouse monoclonal (L6/60, 10 µg/ml) or rabbit polyclonal anti-Slo1 (Alomone, 1:500; Chemicon, 1:200), or mouse monoclonal anti-Kv2.1 (K89/41, TC supe 1:2) antibodies as noted. Numbers to left denote mobility of prestained molecular weight standards in kD.
Fig. 2
Fig. 2. Microheterogeneity of Slo1 in rat brain revealed by L6/60 immunoblot analyses
A: Immunoblot analysis of the effects of alkaline phosphatase (AP) digestion on adult rat brain Slo1. Adult rat brain membranes treated without (−) or with 0.1 U/ml AP (+) for 3 h at 37°C were separated on 7.5% SDS-PAGE and transferred to nitrocellulose membranes, then probed with anti-Kv2.1 (K89/41 mouse mAb, TC supe 1:2), anti-Kv1.4 (K13/31 mouse mAb, TC supe 1:2), anti-GluR1 (rabbit polyclonal antibody, Upstate 1:1000), or anti-Slo1 (L6/60, 10 µg/ml) antibodies. Slo1 exhibited AP- shifts from Mr ≈ 135 to ≈ 128 kD (bands 1 and 2 indicated on the right). Brain Kv2.1 also shifted in Mr upon AP treatment, whereas Kv1.4 and GluR1 did not. B: Immunoblot analysis of developmental rat brain membrane samples. L6/60 (10 µg/ml) immunostaining at postnatal day 2 (P2) revealed at least three distinct bands as indicated in the left margin (1, 135 kD; 2, 131 kD; 3, 124 kD), which changed in their relative proportions during postnatal development. A=adult, C=adult sample incubated 3 h at 37°C without AP, AP=adult sample incubated 3 h at 37°C with AP. Numbers to left denote mobility of prestained molecular weight standards in kD.
Fig. 3
Fig. 3. Immunolocalization of Slo1 in hippocampus
A–C: L6/60 staining in adult rat hippocampus A: overview of L6/60 (0.6 µg/ml) immunoperoxidase staining in hippocampus. B, C: higher magnification images of the staining shown in A. B: stratum lucidum of the CA3 region of the hippocampus. C: magnified view of mossy fiber axons. Arrows in A–C highlight anatomical landmarks that specify the regions magnified. D–E: double label immunofluorescence labeling of brain sections from wild-type (D, WT) and Slo1-deficient (E, KO) mice. Brain sections from these mice were stained with L6/60 (24 µg/ml) mAb in red, and anti-Kv2.1 (KC rabbit polyclonal, 1:100) antibody in green. Images were taken from the hilus of the dentate gyrus and CA3 stratum lucidum. Scale bars, A:, 500 µm; B, C: 100 µm; D: 50 µm.
Fig. 4
Fig. 4. Localization of Slo1 in hippocampal mossy fibers
Magnified view of stratum lucidum of CA3 region of hippocampus. A–C: somata and apical dendrites of CA3 pyramidal neurons were negatively stained with L6/60 (A, 24 µg/ml) as well as with anti-Kv1.4 antibody (B, K13/31 mouse mAb, TC supe 1:2), which overlapped in mossy fibers (C). D–F: in contrast, somatodendritic Kv2.1 (D, KC rabbit polyclonal antibody, 1:100) staining interdigitated with L6/60 staining (E), indicating the presence of Slo1 on synaptic terminals on the Kv2.1-positive apical dendrites of CA3 pyramidal neurons (F, overlay). Scale bars, 10 µm.
Fig. 5
Fig. 5. Effects of an ibotenic acid lesion on the distribution and density of Slo1 immunoreactivity in the hippocampal formation
These photomicrographs show the pattern of immunoreactivity for the indicated subunits in the unoperated, control hemisphere (A–E) and operated hemisphere (F–J) of an animal that sustained a circumscribed unilateral ibotenic acid lesion. This lesion destroyed cells in the distal CA1 subfield, prosubiculum and subiculum, and also destroyed a central portion of the dentate gyrus. The entire CA3 and proximal CA1 subfield was spared by this lesion. This lesion greatly reduced the density of Slo1 (A, F; L6/60 TC supe 1:10), and Kv1.4 (B, G; K13/31 TC supe 1:10) in stratum lucidum of CA3, but did not affect binding of secondary antibody alone (C, H), nor staining for Slo1 (D, I; L6/60 TC supe 1:10), and Kv1.4 (E, J; K13/31 TC supe 1:10) in the terminal fields of striatal effernts to globus pallidus.
Fig. 6
Fig. 6. Slo1 staining in cerebellum
A: low magnification view of L6/60 (0.6 µg/ml) immunoperoxidase staining near the primary fissure. Note moderate to high levels of staining in the molecular layer relative to the granule cell layer, and intense staining at/near the Purkinje cell layer. B: higher magnification view of the area boxed in A, showing intense L6/60 staining in the Purkinje cell layer. The arrowheads point to a Purkinje cell soma, while the arrow points to a basket cell pinceau terminal onto a Purkinje cell initial segment. C–D: Double label immunofluorescence staining of brain sections from wild-type (C: WT) and Slo1-deficient (D: KO) mice. Brain sections from these mice were stained with L6/60 mAb (24 µg/ml) in red, and anti-Kv2.1 (KC rabbit polyclonal, 1:100) antibody in green. Images were taken from the Purkinje cell layer and reveal that staining in Purkinje cell somata, basket cell terminals, and the molecular layer is eliminated in the Slo1 knockout. Scale bars, A:, 100 µm; B, C: 500 µm; D: 10 µm.
Fig. 7
Fig. 7. Slo1 localization in the cerebellar Purkinje cell layer
Confocal images of double label immunofluorescence staining. A–C: Slo1 and Kv1.2 localization in basket cell terminals. L6/60 (A: 24 µg/ml) staining overlaps with that for Kv1.2 (B: K14/16 mouse mAb, 16 µg/ml) in basket cell terminals (C: overlay); D–F: L6/60 (D: 24 µg/ml) staining encircles axon initial segments of Purkinje cells, stained with anti-NF-155/186 antibody (E: L11A/41 mouse mAb, TC supe 1:2; F: overlay). G–H: dendrites of multiple Purkinje cells, filled with anti-calbindin (H: Sigma mouse monoclonal, 16 µg/ml) staining, were associated with membrane-associated L6/60 staining (G: 24 µg/ml; I: overlay). J–L: localization of Slo1 in Purkinje cell somata. Slo1 staining (J: L6/60; 24 µg/ml) on the somata of Purkinje cells partially overlapped with Kv2.1 (K: KC rabbit polyclonal antibody, 1:100) surface clusters (L: overlay). Scale bars, 10 µm.
Fig. 8
Fig. 8. Axonal localization of endogenous Slo1, and exogenous recombinant human Slo1, (hSlo1) in cultured rat hippocampal pyramidal neurons
A–C: Localization of endogenous Slo1. Neurons at 24 DIV were fixed, permeabilized with 0.1% Triton X-100 and stained with anti-Slo1 antibody L6/60 (A: 24 µg/ml; green) to detect the total pool of endogenous rSlo1, and anti-MAP2 (B: Sigma mouse mAb, 1:1000; C: overlay). D–F: Localization of surface hSlo1. Neurons at 11 DIV were fixed, stained with anti-Myc antibody (E: mouse monoclonal 1-9E10, 1 µg/ml) for cell surface hSlo1 (green), and then permeabilized with 0.1% Triton X-100 for L6/60 (D: 5 µg/ml) staining (red) to detect the total pool of exogenous hSlo1 and endogenous rSlo1 (F: overlay). Arrow points to a presumably untransfected neuron in the culture. Panel D inset: hSlo in both axons and dendrites was detected on a longer exposure. G: Surface Myc-positive (mouse mAb 19E10, 1 µg/ml) processes overlap with axonal tau (Sigma mouse monoclonal antibody 1:2000) staining. H–J: Surface Myc-positive (H: mouse mAb 19E10, 1 µg/ml) processes do not overlap with dendritic MAP-2 (I: Sigma mouse mAb, 1:1000) staining (J: overlay). Scale bars, A–F:, 20 µm; D inset: 50 µm ; G: 10 µm; H–J: 10 µm.
Fig. 9
Fig. 9. Presynaptic localization of human Slo1 in cultured hippocampal pyramidal neurons
A–B: Developmental changes of surface hSlo1 staining. Neurons at 11 DIV (A) and 14 DIV (B) were fixed, stained with anti-Myc antibody (mouse mAb 19E10, 1 µg/ml; green), and then permeabilized with 0.1% Triton X-100 for presynaptic synapsin-I staining (Sigma rabbit polyclonal antibody, 1:1000; red). Yellow signal indicates overlap between surface Myc and synapsin-I staining. Scale bar, 20 µm. C–H: Presynaptic but not postsynaptic localization of surface hSlo1. Non-permeabilized neurons were stained with anti-Myc antibody (D, G: mouse mAb 19E10, 1 µg/ml; green), and then permeabilized with 0.1% Triton X-100 for presynaptic synapsin-I (C: Sigma rabbit polyclonal antibody, 1:1000; red) staining (E: overlay) or postsynaptic PSD-95 (F: K28/43 mouse mAb, TC supe 1:10) staining (H: overlay). Scale bars, A–B:, 20 µm; C–H: 10 µm.
Fig. 10
Fig. 10

Similar articles

Cited by

References

    1. Ango F, di Cristo G, Higashiyama H, Bennett V, Wu P, Huang ZJ. Ankyrin-based subcellular gradient of neurofascin, an immunoglobulin family protein, directs GABAergic innervation at purkinje axon initial segment. Cell. 2004;119:257–272. - PubMed
    1. Antonucci DE, Lim ST, Vassanelli S, Trimmer JS. Dynamic localization and clustering of dendritic Kv2.1 voltage-dependent potassium channels in developing hippocampal neurons. Neuroscience. 2001;108:69–81. - PubMed
    1. Arnold DB, Clapham DE. Molecular determinants for subcellular localization of PSD-95 with an interacting K+ channel. Neuron. 1999;23:149–157. - PubMed
    1. Banker GA, Cowan WM. Rat hippocampal neurons in dispersed cell culture. Brain Research. 1977;126:397–425. - PubMed
    1. Bekele-Arcuri Z, Matos MF, Manganas L, Strassle BW, Monaghan MM, Rhodes KJ, Trimmer JS. Generation and characterization of subtype-specific monoclonal antibodies to K+ channel alpha- and beta-subunit polypeptides. Neuropharmacology. 1996;35:851–865. - PubMed

Publication types

MeSH terms