

Resolution of multiple substrate binding sites in cytochrome P450 3A4: the stoichiometry of the enzyme-substrate complexes probed by FRET and Job's titration
- PMID: 16566594
- PMCID: PMC2596942
- DOI: 10.1021/bi052491b
Resolution of multiple substrate binding sites in cytochrome P450 3A4: the stoichiometry of the enzyme-substrate complexes probed by FRET and Job's titration
Abstract
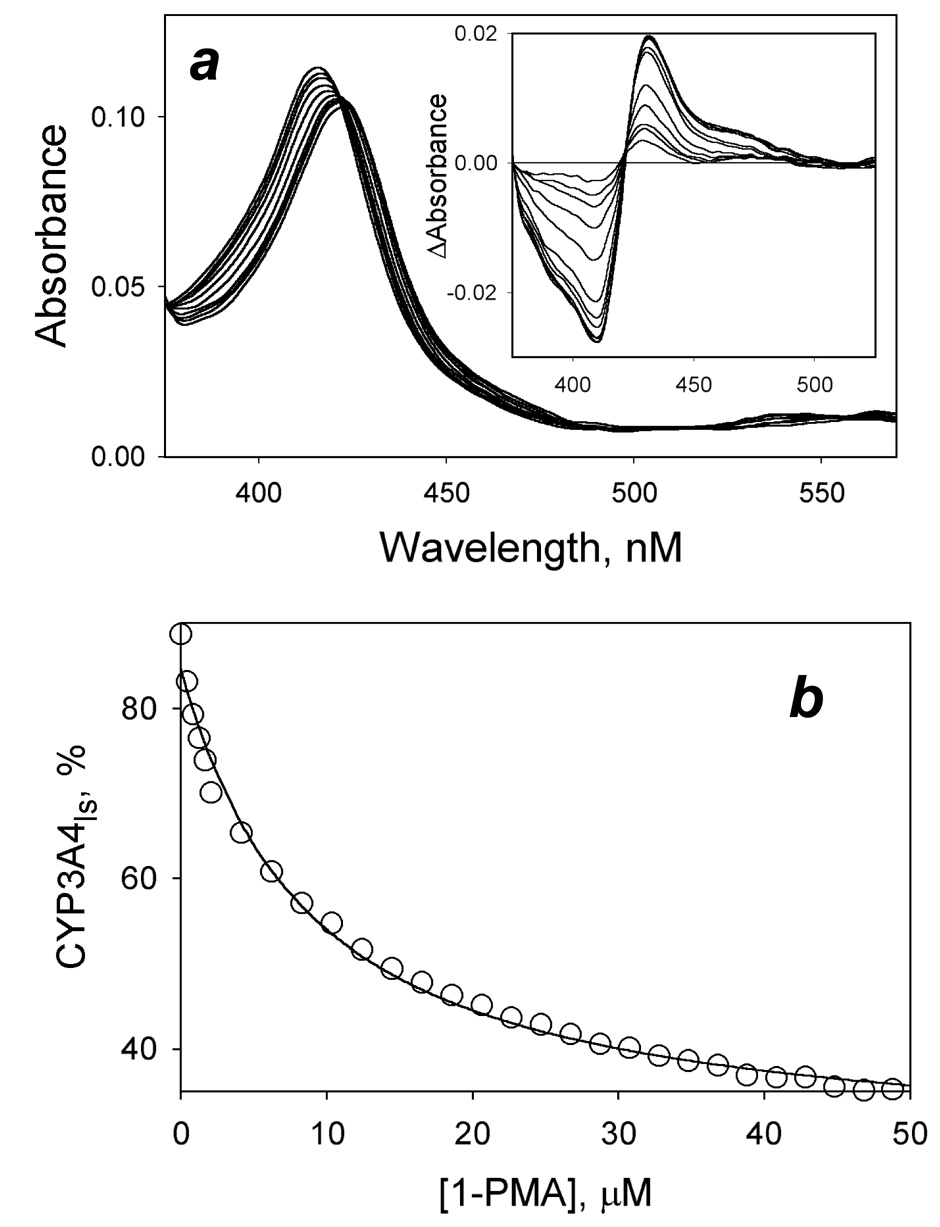
To explore the mechanism of homotropic cooperativity in human cytochrome P450 3A4 (CYP3A4) we studied the interactions of the enzyme with 1-pyrenebutanol (1-PB), 1-pyrenemethylamine (PMA), and bromocriptine by FRET from the substrate fluorophore to the heme, and by absorbance spectroscopy. These approaches combined with an innovative setup of titration-by-dilution and continuous variation (Job's titration) experiments allowed us to probe the relationship between substrate binding and the subsequent spin transition caused by 1-PB or bromocriptine or the type-II spectral changes caused by PMA. The 1-PB-induced spin shift in CYP3A4 reveals prominent homotropic cooperativity, which is characterized by a Hill coefficient of 1.8 +/- 0.3 (S50 = 8.0 +/- 1.1 microM). In contrast, the interactions of CYP3A4 with bromocriptine or PMA reveal no cooperativity, exhibiting KD values of 0.31 +/- 0.08 microM and 7.1 +/- 2.3 microM, respectively. The binding of all three substrates monitored by FRET in titration-by-dilution experiments at an enzyme:substrate ratio of 1 reveals a simple bimolecular interaction with KD values of 0.16 +/- 0.09, 4.8 +/- 1.4, and 0.18 +/- 0.09 microM for 1-PB, PMA, and bromocriptine, respectively. Correspondingly, Job's titration experiments showed that the 1-PB-induced spin shift reflects the formation of a complex of the enzyme with two substrate molecules, while bromocriptine and PMA exhibit 1:1 binding stoichiometry. Combining the results of Job's titrations with the value of KD obtained in our FRET experiments, we demonstrate that the interactions of CYP3A4 with 1-PB obey a sequential binding mechanism, where the spin transition is triggered by the binding of 1-PB to the low-affinity site, which becomes possible only upon saturation of the high-affinity site.
Figures


Similar articles
-
Allosteric mechanisms in cytochrome P450 3A4 studied by high-pressure spectroscopy: pivotal role of substrate-induced changes in the accessibility and degree of hydration of the heme pocket.Biochemistry. 2007 Jul 3;46(26):7852-64. doi: 10.1021/bi602400y. Epub 2007 Jun 8. Biochemistry. 2007. PMID: 17555301 Free PMC article.
-
Role of subunit interactions in P450 oligomers in the loss of homotropic cooperativity in the cytochrome P450 3A4 mutant L211F/D214E/F304W.Arch Biochem Biophys. 2007 Apr 1;460(1):129-40. doi: 10.1016/j.abb.2006.12.025. Epub 2007 Jan 12. Arch Biochem Biophys. 2007. PMID: 17274942 Free PMC article.
-
Variable path length and counter-flow continuous variation methods for the study of the formation of high-affinity complexes by absorbance spectroscopy. An application to the studies of substrate binding in cytochrome P450.Biophys Chem. 2006 Sep 20;123(2-3):95-101. doi: 10.1016/j.bpc.2006.04.007. Epub 2006 Apr 26. Biophys Chem. 2006. PMID: 16701937
-
Structures of cytochrome P450 3A4.Trends Biochem Sci. 2005 Jan;30(1):5-7. doi: 10.1016/j.tibs.2004.11.004. Trends Biochem Sci. 2005. PMID: 15653318 Review.
-
Heterotropic cooperativity of cytochrome P450 3A4 and potential drug-drug interactions.Curr Drug Metab. 2001 Jun;2(2):185-98. doi: 10.2174/1389200013338658. Curr Drug Metab. 2001. PMID: 11469725 Review.
Cited by
-
Allosteric mechanisms in cytochrome P450 3A4 studied by high-pressure spectroscopy: pivotal role of substrate-induced changes in the accessibility and degree of hydration of the heme pocket.Biochemistry. 2007 Jul 3;46(26):7852-64. doi: 10.1021/bi602400y. Epub 2007 Jun 8. Biochemistry. 2007. PMID: 17555301 Free PMC article.
-
Allosteric P450 mechanisms: multiple binding sites, multiple conformers or both?Expert Opin Drug Metab Toxicol. 2008 Dec;4(12):1523-35. doi: 10.1517/17425250802500028. Expert Opin Drug Metab Toxicol. 2008. PMID: 19040328 Free PMC article. Review.
-
Electron transfer in the complex of membrane-bound human cytochrome P450 3A4 with the flavin domain of P450BM-3: the effect of oligomerization of the heme protein and intermittent modulation of the spin equilibrium.Biochim Biophys Acta. 2010 Mar;1797(3):378-90. doi: 10.1016/j.bbabio.2009.12.008. Epub 2009 Dec 21. Biochim Biophys Acta. 2010. PMID: 20026040 Free PMC article.
-
Substrate binding to cytochromes P450.Anal Bioanal Chem. 2008 Nov;392(6):1019-30. doi: 10.1007/s00216-008-2244-0. Epub 2008 Jul 13. Anal Bioanal Chem. 2008. PMID: 18622598 Free PMC article. Review.
-
Allosteric transitions in cytochrome P450eryF explored with pressure-perturbation spectroscopy, lifetime FRET, and a novel fluorescent substrate, Fluorol-7GA.Biochemistry. 2008 Oct 28;47(43):11348-59. doi: 10.1021/bi8011803. Epub 2008 Oct 2. Biochemistry. 2008. PMID: 18831537 Free PMC article.
References
-
- Atkins WM. Implications of the allosteric kinetics of cytochrome P450s. Drug Discovery Today. 2004;9:478–484. - PubMed
-
- Shou MG. The impact of cytochrome P450 allosterism on pharmacokinetics and drug-drug interactions. Drug Discovery Today. 2004;9:636–637. - PubMed
-
- Yoon MY, Campbell AP, Atkins WM. "Allosterism" in the elementary steps of the cytochrome P450 reaction cycle. Drug Metab. Rev. 2004;36:219–230. - PubMed
-
- Ekins S, Stresser DM, Williams JA. In vitro and pharmacophore insights into CYP3A enzymes. Trends Pharm. Sci. 2003;24:161–166. - PubMed
-
- Khan KK, Liu H, Halpert JR. Homotropic versus heterotopic cooperativity of cytochrome P450eryF: A substrate oxidation and spectral titration study. Drug Metab. Disp. 2003;31:356–359. - PubMed
Publication types
MeSH terms
Substances
Grants and funding
LinkOut - more resources
Full Text Sources
