Comparison of P2X and TRPV1 receptors in ganglia or primary culture of trigeminal neurons and their modulation by NGF or serotonin
- PMID: 16566843
- PMCID: PMC1448213
- DOI: 10.1186/1744-8069-2-11
Comparison of P2X and TRPV1 receptors in ganglia or primary culture of trigeminal neurons and their modulation by NGF or serotonin
Abstract
Background: Cultured sensory neurons are a common experimental model to elucidate the molecular mechanisms of pain transduction typically involving activation of ATP-sensitive P2X or capsaicin-sensitive TRPV1 receptors. This applies also to trigeminal ganglion neurons that convey pain inputs from head tissues. Little is, however, known about the plasticity of these receptors on trigeminal neurons in culture, grown without adding the neurotrophin NGF which per se is a powerful algogen. The characteristics of such receptors after short-term culture were compared with those of ganglia. Furthermore, their modulation by chronically-applied serotonin or NGF was investigated.
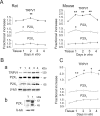
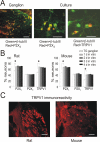
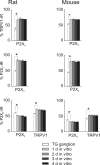
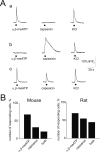
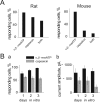
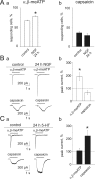
Results: Rat or mouse neurons in culture mainly belonged to small and medium diameter neurons as observed in sections of trigeminal ganglia. Real time RT-PCR, Western blot analysis and immunocytochemistry showed upregulation of P2X(3) and TRPV1 receptors after 1-4 days in culture (together with their more frequent co-localization), while P2X(2) ones were unchanged. TRPV1 immunoreactivity was, however, lower in mouse ganglia and cultures. Intracellular Ca(2+) imaging and whole-cell patch clamping showed functional P2X and TRPV1 receptors. Neurons exhibited a range of responses to the P2X agonist alpha, beta-methylene-adenosine-5'-triphosphate indicating the presence of homomeric P2X(3) receptors (selectively antagonized by A-317491) and heteromeric P2X(2/3) receptors. The latter were observed in 16 % mouse neurons only. Despite upregulation of receptors in culture, neurons retained the potential for further enhancement of P2X(3) receptors by 24 h NGF treatment. At this time point TRPV1 receptors had lost the facilitation observed after acute NGF application. Conversely, chronically-applied serotonin selectively upregulated TRPV1 receptors rather than P2X(3) receptors.
Conclusion: Comparing ganglia and cultures offered the advantage of understanding early adaptive changes of nociception-transducing receptors of trigeminal neurons. Culturing did not prevent differential receptor upregulation by algogenic substances like NGF or serotonin, indicating that chronic application led to distinct plastic changes in the molecular mechanisms mediating pain on trigeminal nociceptors.
Figures


Similar articles
-
P2X₃ and TRPV1 functionally interact and mediate sensitization of trigeminal sensory neurons.Neuroscience. 2013 Mar 1;232:226-38. doi: 10.1016/j.neuroscience.2012.11.015. Epub 2012 Nov 29. Neuroscience. 2013. PMID: 23201260 Free PMC article.
-
Neutralization of nerve growth factor induces plasticity of ATP-sensitive P2X3 receptors of nociceptive trigeminal ganglion neurons.J Neurosci. 2007 Aug 1;27(31):8190-201. doi: 10.1523/JNEUROSCI.0713-07.2007. J Neurosci. 2007. PMID: 17670966 Free PMC article.
-
The transient receptor potential cation channel subfamily V members 1 and 2, P2X purinoceptor 3 and calcitonin gene-related peptide in sensory neurons of the rat trigeminal ganglion, innervating the periosteum, masseter muscle and facial skin.Arch Oral Biol. 2018 Dec;96:66-73. doi: 10.1016/j.archoralbio.2018.08.012. Epub 2018 Aug 30. Arch Oral Biol. 2018. PMID: 30195141
-
Molecular mechanisms of sensitization of pain-transducing P2X3 receptors by the migraine mediators CGRP and NGF.Mol Neurobiol. 2008 Feb;37(1):83-90. doi: 10.1007/s12035-008-8020-5. Epub 2008 May 6. Mol Neurobiol. 2008. PMID: 18459072 Review.
-
Contributions of P2X3 homomeric and heteromeric channels to acute and chronic pain.Expert Opin Ther Targets. 2003 Aug;7(4):513-22. doi: 10.1517/14728222.7.4.513. Expert Opin Ther Targets. 2003. PMID: 12885270 Review.
Cited by
-
Inefficient constitutive inhibition of P2X3 receptors by brain natriuretic peptide system contributes to sensitization of trigeminal sensory neurons in a genetic mouse model of familial hemiplegic migraine.Mol Pain. 2016 May 12;12:1744806916646110. doi: 10.1177/1744806916646110. Print 2016. Mol Pain. 2016. PMID: 27175010 Free PMC article.
-
Adenosine triphosphate drives head and neck cancer pain through P2X2/3 heterotrimers.Acta Neuropathol Commun. 2014 Jun 5;2:62. doi: 10.1186/2051-5960-2-62. Acta Neuropathol Commun. 2014. PMID: 24903857 Free PMC article.
-
Separate functions for responses to oral temperature in thermo-gustatory and trigeminal neurons.Chem Senses. 2016 Jun;41(5):457-71. doi: 10.1093/chemse/bjw022. Epub 2016 Mar 14. Chem Senses. 2016. PMID: 26976122 Free PMC article.
-
In situ imaging reveals properties of purinergic signalling in trigeminal sensory ganglia in vitro.Purinergic Signal. 2017 Dec;13(4):511-520. doi: 10.1007/s11302-017-9576-1. Epub 2017 Aug 18. Purinergic Signal. 2017. PMID: 28822016 Free PMC article.
-
Lipid rafts control P2X3 receptor distribution and function in trigeminal sensory neurons of a transgenic migraine mouse model.Mol Pain. 2011 Sep 29;7:77. doi: 10.1186/1744-8069-7-77. Mol Pain. 2011. PMID: 21958474 Free PMC article.
References
-
- North RA. The P2X3 subunit: a molecular target in pain therapeutics. Curr Opin Investig Drugs. 2003;4:833–840. - PubMed
Publication types
MeSH terms
Substances
Grants and funding
LinkOut - more resources
Full Text Sources
Miscellaneous

