. 2006 Apr 17;203(4):1045-54.
doi: 10.1084/jem.20051954. Epub 2006 Mar 27.

CD4+ T cells that enter the draining lymph nodes after antigen injection participate in the primary response and become central-memory cells

Affiliations

CD4+ T cells that enter the draining lymph nodes after antigen injection participate in the primary response and become central-memory cells

Drew M Catron et al. J Exp Med. .

Abstract

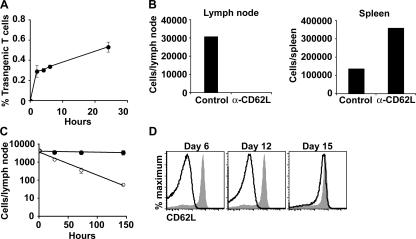
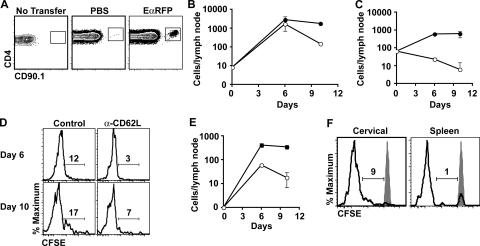
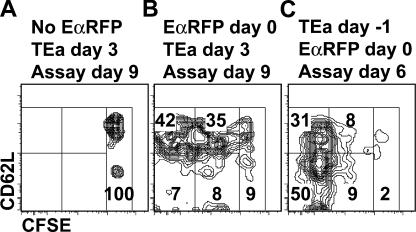
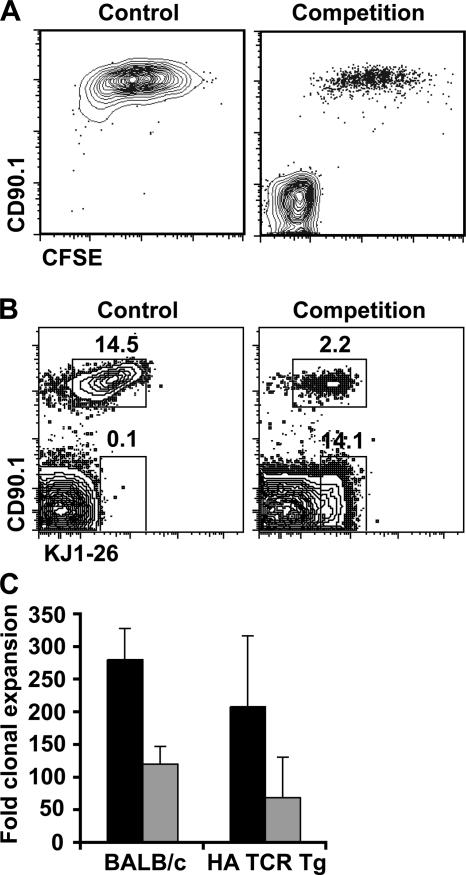
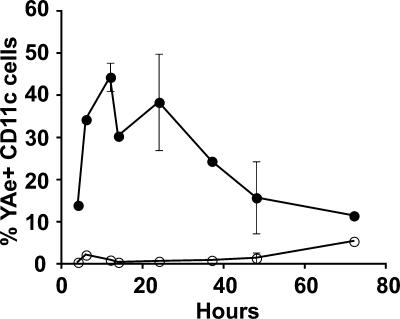
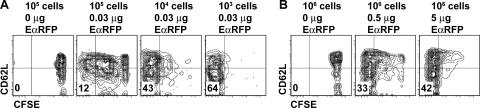
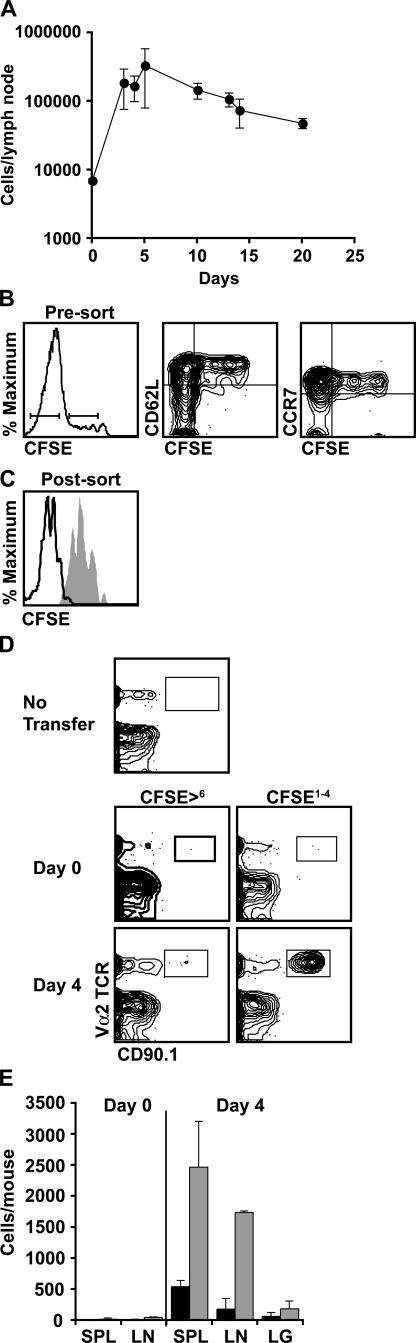
We explored the relationship between the time of naive CD4+ T cell exposure to antigen in the primary immune response and the quality of the memory cells produced. Naive CD4+ T cells that migrated into the skin-draining lymph nodes after subcutaneous antigen injection accounted for about half of the antigen-specific population present at the peak of clonal expansion. These late-arriving T cells divided less and more retained the central-memory marker CD62L than the T cells that resided in the draining lymph nodes at the time of antigen injection. The fewer cell divisions were related to competition with resident T cells that expanded earlier in the response and a reduction in the number of dendritic cells displaying peptide-major histocompatibility complex (MHC) II complexes at later times after antigen injection. The progeny of late-arriving T cells possessed the phenotype of central-memory cells, and proliferated more extensively during the secondary response than the progeny of the resident T cells. The results suggest that late arrival into lymph nodes and exposure to antigen-presenting cells displaying lower numbers of peptide-MHC II complexes in the presence of competing T cells ensures that some antigen-specific CD4+ T cells divide less in the primary response and become central-memory cells.


Figures

Figure 1.
Figure 1.
Naive CD4+ T cell trafficking in skin-draining lymph nodes. (A) Naive TEa CD4+ T cells in the cervical lymph nodes of recipient mice were monitored at different times after injection of 106 cells. CD4 and CD90.1 were used to identify TEa T cells, and percentages relative to endogenous CD4+ T cells are shown. (B) Mice were given control Ig or anti-CD62L antibody, and shortly thereafter TEa T cells. The number of TEa cells in the cervical lymph nodes or spleen 5 d after transfer are shown. (C) Mice received TEa T cells, and the next day control Ig (•) or anti-CD62L antibody (○). The number of TEa cells in the cervical lymph nodes over time is shown. (D) CD62L expression on endogenous CD4+ T cells at the indicated times after treatment with anti-CD62L antibody are shown (white histograms). Gray histograms show CD62L expression on CD4+ T cells from untreated animals. Error bars in A and C represent standard deviation (n = 2). Data are representative of three independent experiments.
Figure 2.
Figure 2.
The contribution of late-arriving T cells to the local immune response in skin-draining lymph nodes. (A) 10,000 TEa T cells were injected into recipient mice, which were then injected with PBS (middle) or 30 ng of EαRFP plus LPS in the ear (right). 6 d after antigen injection, cervical lymph node cells from these mice, or mice that did not receive TEa cells (left), were identified as CD4+ and CD90.1+ cells. Contour plots of CD4 versus CD90.1 on CD11b, B220, and CD8α cells are shown. (B) Recipients of 104 TEa cells were injected with control Ig (•) or anti-CD62L antibody (○) followed shortly thereafter by 30 ng of EαRFP plus LPS in the ear. Transgenic cells were detected as described in A in the cervical (B) or mesenteric lymph nodes (C) of the treated mice at the indicated times. (D) CFSE histograms of TEa T cells in the cervical lymph nodes from control or anti-CD62L–treated mice shown in B. (E) Numbers of cells that had divided one to six times (using gates from D) from mice treated with control Ig (•) or anti-CD62L (○). The gate used to identify cells that had divided one to six times was based on the intensity of unstained endogenous CD4+ T cells, and the CFSE level of undivided TEa cells from unprimed animals. (F) CFSE histograms of TEa T cells from cervical lymph nodes and spleens of mice 6 d after immunization with EαRFP plus LPS are shown. Gray histograms represent naive TEa T cells from unprimed mice. All error bars represent SD (n = 2). Data are representative of three independent experiments.
Figure 3.
Figure 3.
Cell division history of late-arriving T cells. Mice were injected intradermally with PBS (A) or 30 ng EαRFP plus LPS (B) and given 104 CFSE-labeled TEa T cells 3 d later. TEa T cell division and CD62L expression in draining lymph nodes was analyzed 6 d after cell transfer. The contour plots display CFSE versus CD62L levels on CD4+, CD90.1+, CD11b, B220, CD8α lymphocytes. Percentages of cells that had undergone zero, one to six, or more than six divisions are shown according to their CD62L expression. (C) Other mice were given 104 CFSE-labeled TEa T cells first and then injected with EαRFP plus LPS and analyzed 6 d later. Data are representative of three independent experiments.
Figure 4.
Figure 4.
Late-arriving T cells and intraclonal competition. BALB/c mice (A) or RAG-deficient HA TCR transgenic mice (B) received 104 CD90.2+ DO11.10 T cells (competitors) or no cells at all, followed by an intradermal injection of OVA plus LPS the next day. 6 d after antigen injection, all mice received 104 CFSE-labeled CD90.1+ DO11.10 T cells (late arrivers). The antigen-draining cervical lymph nodes were analyzed 6 d after transfer. In BALB/c recipients, CD90.1 and CFSE levels were measured on CD4+, KJ1-26+, CD11b, B220 lymphocytes. CFSE-labeled CD90.1+ DO11.10 T cells are visible in the top portion of both plots in A, whereas unlabeled CD90.2+ DO11.10 T cells are visible in the lower left corner of the right plot in A. CFSE dye dilution was not informative in the HA TCR transgenic recipients because of homeostatic proliferation of the transferred cells in the absence of OVA. Therefore, in these recipients, the competitor DO11.10 cells were identified as CD4+, CD90.1, KJ1-26+, B220, CD11b cells (visible in the bottom box in the right panel of B), and the late-arriving DO11.10 cells as CD4+, CD90.1+, KJ1-26+, B220, CD11b cells (visible in the top box in both panels in B). The mean fold expansion (± SD, n = 2) for late arrivers in the absence (black bars) or presence (gray bars) of competitors was defined as the number of late arrivers present on day 6 divided by the number present in mice that did not receive antigen, and is shown in C. Data are representative of three independent experiments.
Figure 5.
Figure 5.
Display of pEα–MHC II complexes on dendritic cells in antigen-draining lymph nodes over time. 50 μg of EαRFP plus LPS (•) or LPS alone (○) was injected intradermally into the ears of mice, and the levels of pEα–MHC II complexes on CD11c+ dendritic cells were analyzed by Y-Ae staining at different times thereafter. The mean percentage of Y-Ae+ cells is shown. Data were pooled from multiple experiments and error bars represent SDs (n = 1–3).
Figure 6.
Figure 6.
The relationship between clonal frequency and antigen dose. (A) Naive B6 recipient mice were injected with 103, 104, or 105 CFSE-labeled TEa T cells and then immunized intradermally in each ear with 0 or 30 ng of EαRFP plus LPS, or (B) 106 CFSE-labeled TEa T cells and then immunized with 0, 0.5, or 5 μg of EαRFP plus LPS. 4 (B) or 6 d (A) later, the TEa cells were identified as CD4+, CD90.1+, B220, CD11b, CD8α lymphocytes and analyzed for CFSE dye dilution and CD62L expression. The percentage of CD62Llow cells with greater than six cell divisions is indicated on each contour plot. Data are representative of three independent experiments.
Figure 7.
Figure 7.
The relationship between cell division history and memory cell potential. Naive B6 recipients injected with 106 CFSE-labeled CD90.1+ TEa T cells were given 10 μg EαRFP plus LPS intradermally in each ear. The mean number (± SD) of TEa T cells in the draining lymph nodes at the indicated times after antigen injection is shown in A. (B) 17 d after antigen injection, CD4+, CD90.1+ T cells from the draining lymph nodes were enriched by negative selection with magnetic beads and sorted into two populations: cells that had undergone one to four divisions (CFSE1–4; right gate) and cells that had undergone more than six divisions (CFSE>6; left gate). CD62L and CCR7 levels on presorted cells are shown. (C) Post-sort analysis showed clear separation of the CFSE>6 (white histogram) and CFSE1–4 (gray histogram) cells. 2,000 cells of each type were then transferred into new naive B6 recipients. (D) 1 d after transfer (middle), or 1 d after transfer and 4 d after intravenous injection of EαRFP plus LPS (bottom), spleen, lymph nodes, and lungs were analyzed for the presence of TEa cells using the anti-CD90.1 magnetic bead enrichment technique (as described in Materials and methods). The contour plots display CD90.1 versus TCR Vα2 expression on CD4+, B220, CD11b, CD8α lymphocytes, with TEa T cells shown in the box. A contour plot from a mouse that did not receive TEa T cells is shown in the top panel of D as a negative control. (E) The mean number of TEa T cells in spleen (SPL) and lymph nodes (LN) on day 0 and spleen, lymph nodes, and lungs (LG) on day 4 after antigen challenge are shown. Error bars repre-sent SD (n = 2). Data are representative of at least three independent experiments.

References

    1. Jenkins, M.K., A. Khoruts, E. Ingulli, D.L. Mueller, S.J. McSorley, R.L. Reinhardt, A. Itano, and K.A. Pape. 2001. In vivo activation of antigen-specific CD4 T cells. Annu. Rev. Immunol. 19:23–45. - PubMed
    1. Seder, R.A., and R. Ahmed. 2003. Similarities and differences in CD4+ and CD8+ effector and memory T cell generation. Nat. Immunol. 4:835–842. - PubMed
    1. Sallusto, F., D. Lenig, R. Forster, M. Lipp, and A. Lanzavecchia. 1999. Two subsets of memory T lymphocytes with distinct homing potentials and effector functions. Nature. 401:708–712. - PubMed
    1. Reinhardt, R.L., A. Khoruts, R. Merica, T. Zell, and M.K. Jenkins. 2001. Visualizing the generation of memory CD4 T cells in the whole body. Nature. 410:101–105. - PubMed
    1. Masopust, D., V. Vezys, A.L. Marzo, and L. Lefrancois. 2001. Preferential localization of effector–memory cells in nonlymphoid tissue. Science. 291:2413–2417. - PubMed

Publication types

MeSH terms