. 2006 Apr;127(4):449-65.
doi: 10.1085/jgp.200509436.

Mechanism of beta4 subunit modulation of BK channels

Affiliations

Mechanism of beta4 subunit modulation of BK channels

Bin Wang et al. J Gen Physiol. 2006 Apr.

Abstract

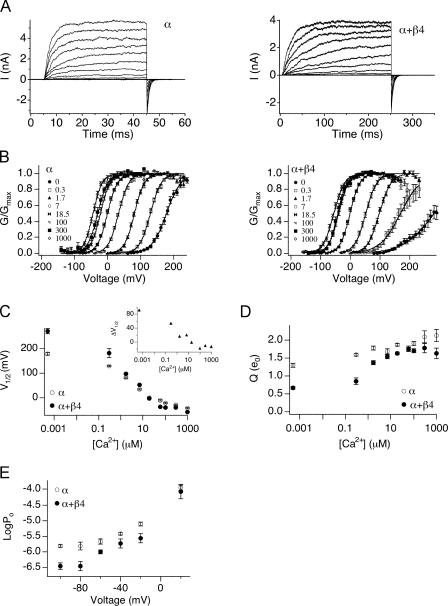
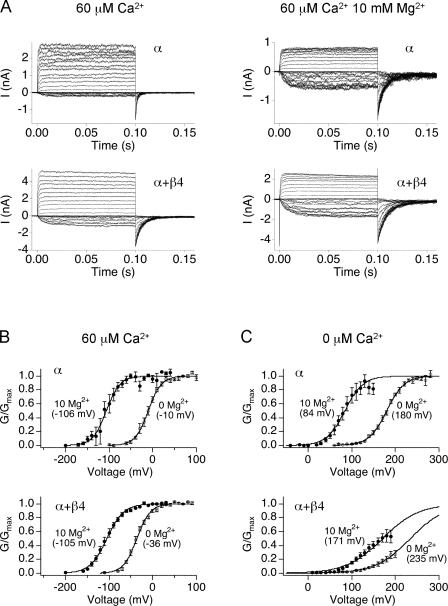
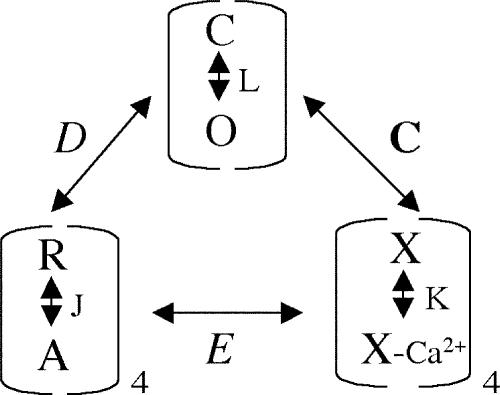
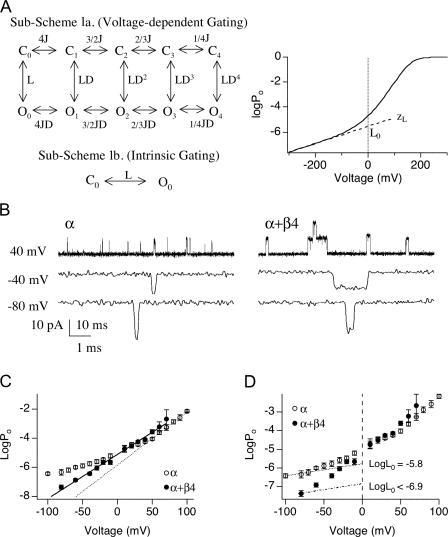
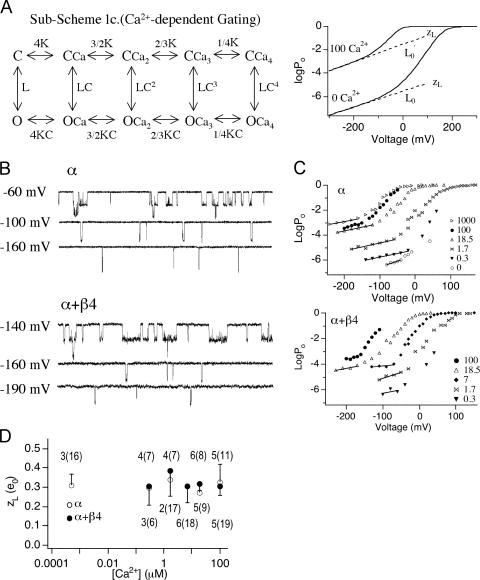
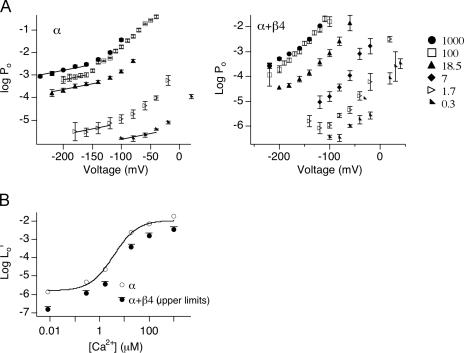
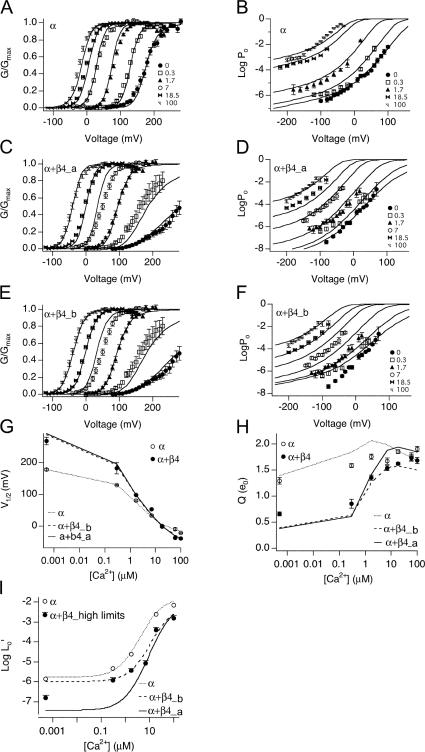
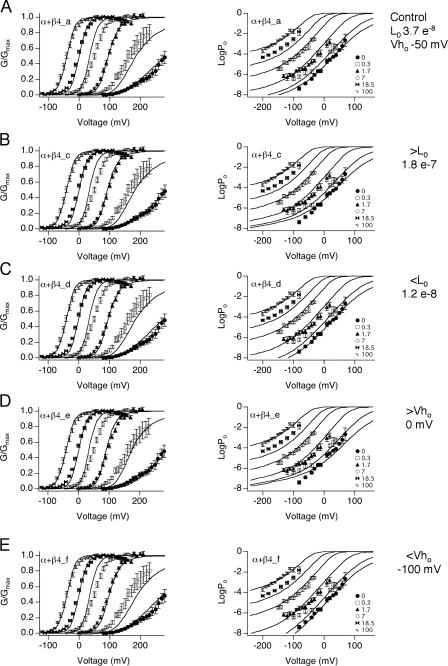
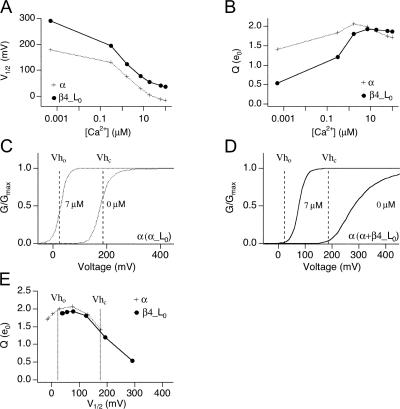
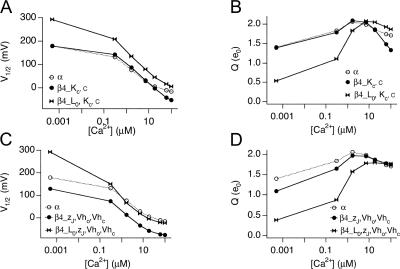
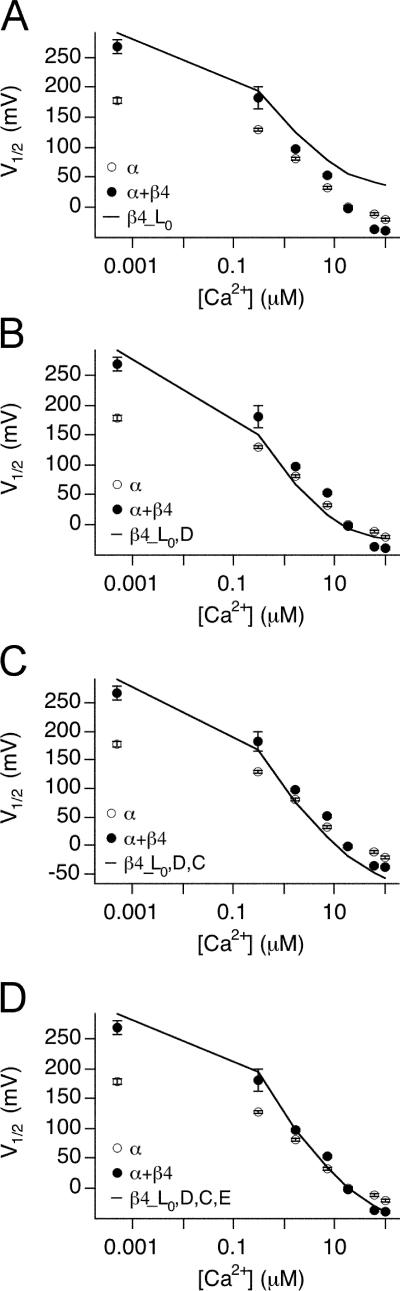
Large-conductance (BK-type) Ca(2+)-activated potassium channels are activated by membrane depolarization and cytoplasmic Ca(2+). BK channels are expressed in a broad variety of cells and have a corresponding diversity in properties. Underlying much of the functional diversity is a family of four tissue-specific accessory subunits (beta1-beta4). Biophysical characterization has shown that the beta4 subunit confers properties of the so-called "type II" BK channel isotypes seen in brain. These properties include slow gating kinetics and resistance to iberiotoxin and charybdotoxin blockade. In addition, the beta4 subunit reduces the apparent voltage sensitivity of channel activation and has complex effects on apparent Ca(2+) sensitivity. Specifically, channel activity at low Ca(2+) is inhibited, while at high Ca(2+), activity is enhanced. The goal of this study is to understand the mechanism underlying beta4 subunit action in the context of a dual allosteric model for BK channel gating. We observed that beta4's most profound effect is a decrease in P(o) (at least 11-fold) in the absence of calcium binding and voltage sensor activation. However, beta4 promotes channel opening by increasing voltage dependence of P(o)-V relations at negative membrane potentials. In the context of the dual allosteric model for BK channels, we find these properties are explained by distinct and opposing actions of beta4 on BK channels. beta4 reduces channel opening by decreasing the intrinsic gating equilibrium (L(0)), and decreasing the allosteric coupling between calcium binding and voltage sensor activation (E). However, beta4 has a compensatory effect on channel opening following depolarization by shifting open channel voltage sensor activation (Vh(o)) to more negative membrane potentials. The consequence is that beta4 causes a net positive shift of the G-V relationship (relative to alpha subunit alone) at low calcium. At higher calcium, the contribution by Vh(o) and an increase in allosteric coupling to Ca(2+) binding (C) promotes a negative G-V shift of alpha+beta4 channels as compared to alpha subunits alone. This manner of modulation predicts that type II BK channels are downregulated by beta4 at resting voltages through effects on L(0). However, beta4 confers a compensatory effect on voltage sensor activation that increases channel opening during depolarization.


Figures

Figure 1.
Figure 1.
The effects of β4 on the mslo steady-state G-V relation vary with [Ca2+]. (A) Examples of currents evoked by voltage steps in 7 μM [Ca2+]. α alone is shown in the left panel, α+β4 is shown in the right panel. (B) Mean G-V relations at different [Ca2+] for α alone and α+β4. Each point represents mean data from 8 to 44 experiments. Solid curves represent fits to the Boltzmann function. (C) Mean V1/2 values plotted as a function of [Ca2+]. β4 shifts V1/2 toward more positive voltages <18.5 μM [Ca2+], and toward more negative voltages >18.5 μM [Ca2+]. Inset, α+β4 V1/2 subtracted from mean α alone values. (D) Mean effective gating charge, Q, plotted as a function of [Ca2+]. In the presence of β4 there is a decrease in Q, and a more dramatic increase in Q can be observed as [Ca2+] increases. (E) Mean Po as a function of voltage in the absence (5–7 patches) and presence (2–6 patches) of β4 in 300 nM Ca2+. Error bars represent SEM.
Figure 2.
Figure 2.
Ability of 10 mM Mg2+ to promote channel gating is decreased in the presence of β4. (A) BK α (top) and α+β4 (bottom) currents are recorded in 60 μM Ca2+/0 Mg2+ (left) and 60 μM Ca2+/10 mM Mg2+ (right). (B) Conductance–voltage relationships in 60 μM Ca2+ with (5 patches for α and 9 patches α+β4) and without 10 mM MgCl2 (9 patches for α and 17 patches α+β4) or (C) nominally 0 Ca2+ with (7 patches for α and 6 patches α+β4) and without (12 patches for α and 6 patches α+β4) 10 mM MgCl2. Error bars represent SEM.
(SCHEME 1)
(SCHEME 1)
Figure 3.
Figure 3.
β4 increases the intrinsic energetic barrier for channel to open. (A, left) According to the dual-allosteric mechanism (Horrigan and Aldrich, 1999, 2002), BK channel transitions between closed (C) and open (O) conformation is allosterically regulated by the state of four independent and identical voltage sensors. Sub-Scheme 1a represents BK channel's gating scheme at 0 Ca2+. Channel resides in either open or closed conformation, with 0–4 voltage sensors in the activated state. Equilibrium between C-O transitions is allosterically regulated by the states of the voltage sensors. Sub-Scheme 1b represents BK channel's gating scheme at 0 Ca2+ and very negative voltages. With all voltage sensors in the resting state, channel resides in one of two conformations, C0 and O0. Equilibrium between the C0–O0 transition is described by L, the intrinsic equilibrium for channel opening in the absence of Ca2+ and voltage sensor activation. (A, right) Illustration of how two components of L (L0 and zL) can be estimated by logPo-V data at 0 Ca2+ and negative voltages. Curve represents simulated logPo vs. voltage curve in nominally 0 Ca2+. Gating parameters used for simulation are as follows; L0 = 2.5 × 10⁻⁶, zL = 0.39 e0, zJ = 0.54 e0, Vhc = 173 mV, Vho = 25 mV. Dashed line represents fit for logPo-V at limiting slope using Eq. 4. L0 and zL can be derived from the fit. (B) Single-channel BK currents recorded in nominally 0 Ca2+ at indicated voltages. At −80 mV, α alone data was obtained from a patch containing ∼706 channels, and α+β4 data was obtained from a patch containing estimated ∼730 channels. At both −40 and +40 mV, α alone data was obtained from a patch with estimated ∼123 channels, and α+β4 data was obtained from a patch with estimated ∼411 channels. All traces were low-pass filtered at 3 kHz, except for α alone at −80 mV, which was filtered at 8.4 kHz. (C) Limiting slope is not reached for the logPo-V data in the presence of β4. Mean logPo as a function of voltage in the absence and presence of β4 in nominally 0 Ca2+ (3–12 patches for α and 4–11 patches for α+β4). Error bars represent SEM. The voltage dependence (slope) for α alone channels shows an apparent decrease at approximately +30 mV. For α+β4 channels, no apparent change in slope is observed over the voltage range between −80 and +70 mV. (D) β4 decreases L0 by at least 11-fold. Data from C replotted to show that estimates of L0 for α alone channels obtained by extrapolating logPo-V relations from limiting slope to 0 mV. An upper limit of L0 for α+β4 channels was estimated using Eq. 4, based on the mean Po value at −80 mV and a zL value of 0.3 e0.
Figure 4.
Figure 4.
β4 effects on zL in the presence of Ca2+. (A, left) According to the dual-allosteric mechanism (Horrigan and Aldrich, 2002), BK channel transitions between closed (C) and open (O) conformation is allosterically regulated by the state of four independent and identical Ca2+ binding sites. Sub-Scheme 1c represents BK channel's gating scheme at very negative voltages, where voltage sensors remain in the resting states. Channel resides in either closed or open conformations, with 0–4 Ca2+ binding sites occupied. Equilibrium between the C–O transitions is allosterically regulated by the states of the Ca2+ binding sites. In the absence of voltage sensor activation, voltage dependence of the C–O transition is entirely dependent on zL. (A, right) Illustration of how zL can be estimated by logPo-V data at high Ca2+ and very negative voltages. Curves are simulated logPo-V curves in nominally 0 Ca2+ and 100 μM Ca2+ according to Scheme 1c. Gating parameters used for simulation are as follows: L0 = 2.5 × 10⁻⁶, zL = 0.39 e0, zJ = 0.54 e0, Vhc = 173 mV, Vho = 25 mV, Kc = 13.9 μM, and Ko = 1.4 μM. Dashed lines represent fits for logPo-V at limiting slopes using Eq. 8. L0′ and zL can be derived from the fits. (B) At 100 μM Ca2+, currents were recorded at very negative voltages to determine logPo vs. V relations. Currents were low-pass filtered at 20 kHz. Representative current traces at indicated voltages in the absence and presence of β4, respectively. Traces in B were all obtained from the same patch. Currents were filtered at 5 kHz for display purposes. (C) Representative logPo-V relations at various Ca2+ where limiting slopes is reached. Upper limits for zL were estimated from the apparent limiting slopes (solid lines). (D) Estimates of zL plotted as a function of [Ca2+] for α subunits alone (open symbols) and α+β4 (closed symbols) for patches where limiting slope was reached. Error bars represent SEM. The number of patches where limiting slope was reached as well as total number of recordings performed (in parenthesis) at each [Ca2+] are indicated.
Figure 5.
Figure 5.
Effect of β4 on Ca2+-dependent gating. (A) Symbols represent logPo-V relations at various [Ca2+]. Error bars represent SEM. Lines are fits for mean logPo-V at limiting slope using Eq. 8 and zL of 0.3 e0. L0′ for α alone channels were derived from the fits. (B) Open symbols are logL0′ vs. [Ca2+] for α alone. Curve represents fit of logL0′-[Ca2+] using Eq. 7. For α+β4, only an upper limit for logL0′ is estimated and displayed as solid symbols (solid circles with an overhanging line) and therefore were not fit with Eq. 7.
Figure 6.
Figure 6.
Evaluation of fit parameters α, α+β4_a, and α+β4_b. Po-V relations at 0.0005, 0.3, 1.7, 7, 18.5 and 100 μM Ca2+ were simulated using indicated fit parameters (Table III) and fit to the Boltzmann function. (A and B) The fit from α is superimposed on a series of G-V data for α alone channels from macroscopic recordings, and Po-V data from single channel recordings, respectively. (C and D) The fit from α+β4_a (fit to G-V and low voltage Po-V relations) is superimposed on G-V and Po-V data for α+β4 channels, respectively. (E and F) The fit from α+β4_b (fit to G-V only) is superimposed on the same series of data as in C and D. (G) V1/2 vs. [Ca2+], (H) Q vs. [Ca2+], and (I) logL0′ vs. [Ca2+]. Simulations based on fit parameters (Table III) are compared with mean ± SEM of measurements (symbols).
Figure 7.
Figure 7.
Evaluation of fit parameters α+β4_c through α+β4_f. Fits are superimposed on the same series of G-V (left) and Po-V data (right). Individual parameters that are fixed are shown on the right. Parameters obtained are shown in Table III. (A) Best fit (α+β4_a) from Fig. 6 (C and D) for comparison. Fixed parameters are (B) increasing L0 threefold to 1.8 e−7, (C) decreasing L0 threefold to 1.2 e−8, (D) 50 mV positive shift of Vho to 0 mV, (E) −50 mV shift of Vho to −100 mV.
Figure 8.
Figure 8.
Changes in G-V relations as a consequence of β4 modulation of L0. Simulations using α subunit parameters from Table III, with α L0 (plus symbols) or α+β4 L0 (closed symbols). (A) Effect of L0 modulation on V1/2 vs. [Ca2+] relationship, and (B) Q vs. [Ca2+] relationship. V1/2 and Q of simulated G-V were obtained from Boltzmann fit to simulated Po-V curves. (C–E) Illustration of how L0 and [Ca2+] affect Q by influencing position of G-V curves relative to Vho and Vhc. (C) Simulation of G-V curves in 7 μM (dashed line) and 0 calcium (solid line) relative to Vho and Vhc (vertical dash lines) using α subunit L0 parameter. (D) Same as C but using α+β4 L0 parameter. (E) Q vs. V1/2 relationships illustrates how position of V1/2 relative to Vho and Vhc affects Q values.
Figure 9.
Figure 9.
Negative shift of Vho has the most significant contribution in opposing decrease in L0 and increasing α+β4 channel opening. Data points are simulated values based on α subunit parameters in Table III with indicated parameters replaced by those of α+β4. (A and B) Effects of β4 modulation on Ca2+-dependent gating. (C and D) Changes in G-V relations as a consequence of β4 modulation on voltage-dependent gating. Plotted are V1/2-[Ca2+] and Q-[Ca2+] relations when α parameters are replaced by indicated α+β4 parameters.
Figure 10.
Figure 10.
Additive effects of β4 gating parameters on BK channel steady-state properties. Simulations with α subunit parameters incrementally replaced by those of α+β4. Panels show experimental data for α (open symbols) and α+β4 (closed symbols) V1/2 vs. [Ca2+] relationship. Line shows simulations using α subunit parameters incrementally altered by β4 L0 (A), β4 L0 + D (B), β4 L0 + D +C (C), β4 L0 + D +C +E (D).

Similar articles

Cited by

References

    1. Bao, L., and D.H. Cox. 2005. Gating and ionic currents reveal how the BKCa channel's Ca2+ sensitivity is enhanced by its β1 subunit. J. Gen. Physiol. 126:393–412. - PMC - PubMed
    1. Behrens, R., A. Nolting, F. Reimann, M. Schwarz, R. Waldschutz, and O. Pongs. 2000. hKCNMB3 and hKCNMB4, cloning and characterization of two members of the large-conductance calcium-activated potassium channel β subunit family. FEBS Lett. 474:99–106. - PubMed
    1. Brenner, R., Q.H. Chen, A. Vilaythong, G.M. Toney, J.L. Noebels, and R.W. Aldrich. 2005. BK channel β4 subunit reduces dentate gyrus excitability and protects against temporal lobe seizures. Nat. Neurosci. 8:1752–1759. - PubMed
    1. Brenner, R., T.J. Jegla, A. Wickenden, Y. Liu, and R.W. Aldrich. 2000. Cloning and functional characterization of novel large conductance calcium-activated potassium channel β subunits, hKCNMB3 and hKCNMB4. J. Biol. Chem. 275:6453–6461. - PubMed
    1. Cox, D.H., and R.W. Aldrich. 2000. Role of the β1 subunit in large-conductance Ca2+-activated K+ channel gating energetics. Mechanisms of enhanced Ca2+ sensitivity. J. Gen. Physiol. 116:411–432. - PMC - PubMed

Publication types

MeSH terms

Substances