. 2006 Mar 27;172(7):1035-44.
doi: 10.1083/jcb.200512012.

Vectorial insertion of apical and basolateral membrane proteins in polarized epithelial cells revealed by quantitative 3D live cell imaging

Affiliations

Vectorial insertion of apical and basolateral membrane proteins in polarized epithelial cells revealed by quantitative 3D live cell imaging

Wei Hua et al. J Cell Biol. .

Abstract

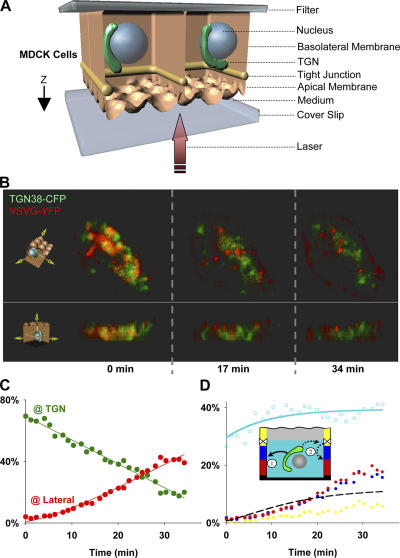
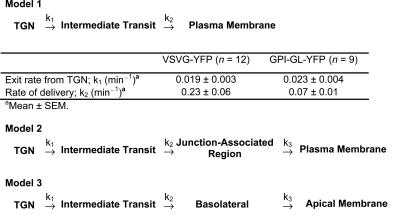
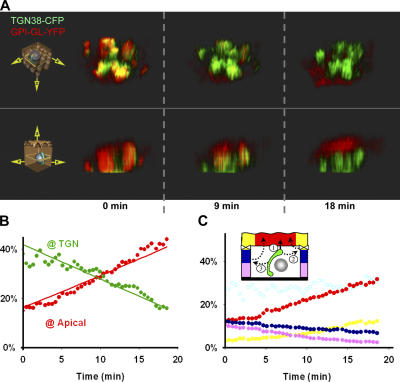
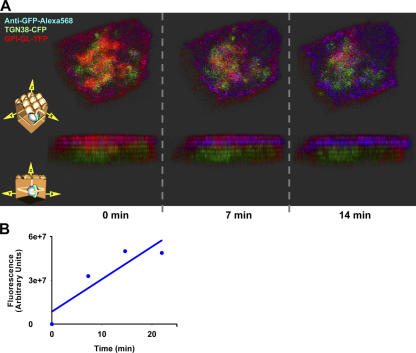
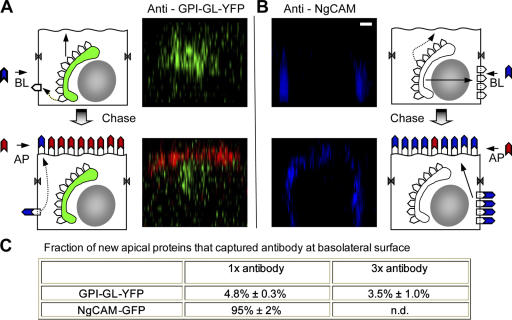
Although epithelial cells are known to exhibit a polarized distribution of membrane components, the pathways responsible for delivering membrane proteins to their appropriate domains remain unclear. Using an optimized approach to three-dimensional live cell imaging, we have visualized the transport of newly synthesized apical and basolateral membrane proteins in fully polarized filter-grown Madin-Darby canine kidney cells. We performed a detailed quantitative kinetic analysis of trans-Golgi network (TGN) exit, passage through transport intermediates, and arrival at the plasma membrane using cyan/yellow fluorescent protein-tagged glycosylphosphatidylinositol-anchored protein and vesicular stomatitis virus glycoprotein as apical and basolateral reporters, respectively. For both pathways, exit from the TGN was rate limiting. Furthermore, apical and basolateral proteins were targeted directly to their respective membranes, resolving current confusion as to whether sorting occurs on the secretory pathway or only after endocytosis. However, a transcytotic protein did reach the apical surface after a prior appearance basolaterally. Finally, newly synthesized proteins appeared to be delivered to the entire lateral or apical surface, suggesting-contrary to expectations-that there is not a restricted site for vesicle docking or fusion adjacent to the junctional complex.


Figures

Figure 1.
Figure 1.
3D time-lapse confocal imaging and quantification of the transport of VSVG-YFP to the basolateral surface in single fully polarized MDCK cells. (A) Illustration of the MDCK cell domains and orientation for 3D live cell imaging. MDCK cells were grown on polycarbonate filters and transfected as described in Materials and methods. A piece of filter was excised and inverted on a coverslip in a medium-filled dish. The dish was placed in a temperature-controlled chamber mounted on a laser scanning confocal microscope. (B) 3D transport of newly synthesized VSVG-YFP from the TGN to the basolateral membrane. Transport from the TGN (marked by TGN38-CFP, green) was monitored at 31°C, with complete z-axis stacks taken every minute. Individual stacks were assembled as videos. Here, the same cell is viewed from two different orientations (looking down from the apical side and from the lateral side), as illustrated by the 3D cell diagram, at three time points of chase: 0, 17, and 34 min. VSVG-YFP (red) at 0 min largely colocalized with the TGN marker and gradually exited from the TGN to appear at the lateral surface (Video 1, available at http://www.jcb.org/cgi/content/full/jcb.200512012/DC1). (C) Kinetics of VSVG-YFP transport from the TGN to the lateral surface (same cell as in B.). The presence of VSVG-YFP in the TGN (TGN38-CFP–positive volumes, green dots) or at the lateral surface (including ∼1.5 μm of adjacent cytoplasmic volume, red dots) was quantified from the 3D renderings. Global fit (solid lines) of the two-step pathway (Fig. 2, model 1) to the two curves yielded k1 = 0.02 min−1, k2 = 0.11 min−1, and R2 = 0.9857. The data shown are collected from a single cell, and the rate constants are representative of measurements from 12 different cells as summarized in Fig. 2. (D) Spatial distribution of VSVG-YFP (same cell as in B and C). The distribution of VSVG-YFP on three equal vertical sections of the lateral membrane was determined at each time point from the 3D renderings. The Xs demarcate the approximate location of the tight junction. Each data point represents the percentage of VSVG-YFP present in the section of the diagrammed membrane and was color coded accordingly. The fluorescence in the apical-most segment (yellow dots) was lowest, but this region also contains a portion of the lateral domain that is apical to the junctional complex. The dashed line is the predicted fluorescence in the junction-associated region if VSVG-YFP was first inserted at this site, according to model 2 (Fig. 2), with k3 = 0.12 min−1, the fastest sorting rate cited in polarized MDCK cells (Sheff et al., 2002). The yellow dots, which correspond to a portion of the apical region, deviate significantly from this prediction. Open cyan circles represent the amount of VSVG-YFP fluorescence at each time point that could not be accounted for either at the lateral membrane or in the TGN. Solid cyan line represents the fit to model 1 (Fig. 2). The dimensions of the cell image shown (x, y, and z) are ∼12, 14, and 8 μm.
Figure 2.
Figure 2.
The rate of exit from the TGN and delivery to the destined plasma membrane measured by live cell imaging.
Figure 3.
Figure 3.
3D transport of GPI-GL-YFP to the apical domain. (A) 3D transport of newly synthesized GPI-GL-YFP (red) from the TGN (TGN38-CFP, green) to the apical membrane (including the underlying cytoplasmic volume within an ∼2-μm distance from the cell margin) at various time points of chase at 31°C. Two different orientations of the same cell are illustrated (looking up from the basal side and from the lateral side). (B) Kinetics of GPI-GL-YFP transport from the TGN to the apical domain. The presence of GPI-GL-YFP in the TGN or in the entire apical domain was quantified at each time point from the 3D renderings. Global fit (solid lines) of the two-step pathway (Fig. 2, model 1) to the two curves yielded k1 = 0.02 min−1, k2 = 0.09 min−1, and R2 = 0.918. (C) Spatial distribution of GPI-GL-YFP on the apical and lateral membranes. Appearance of GPI-GL-YFP in a central region of the apical membrane (red), defined as the region spanning half the distance from the cell axis to the cell margin (and the underlying volume, as described above), was compared with the appearance of fluorescence at the perimeter of the apical domain, which also contained one third of the lateral domain (yellow). Each data point corresponds to the percentage of GPI-GL-YFP that is distributed in the corresponding section of the diagram at each time point. The Xs demarcate the approximate location of the tight junction. Open cyan circles represent signal not accounted for at the apical or lateral domains or at the TGN. The dimensions of the cell image shown (x, y, and z) are ∼11, 6, and 10 μm.
Figure 4.
Figure 4.
Antibody-binding assay to detect the delivery of GPI-GL-YFP to the apical surface. (A) The delivery of GPI-GL-YFP (red) from the TGN (TGN38-CFP, green) to the apical domain in a live fully polarized MDCK cell was imaged as in Fig. 3 except that a conjugated anti-GFP antibody (blue) was added to the apical medium. GPI-GL-YFP molecules appearing apically became accessible to the antibody, which concentrated at the apical surface. Two different orientations of the same cell are illustrated (looking down from the apical side and from the lateral side). The cell at 7 min was also digitally sectioned in Video 5 (available at http://www.jcb.org/cgi/content/full/jcb.200512012/DC1) to expose the distribution of GPI-GL-YFP in the TGN and subapical regions. (B) Kinetics of anti-GFP accumulation at the apical membrane. Data points were determined from the quantitation of 3D renderings (same cell as in A) at each time point. The solid line is not a curve fit but rather represents the kinetics of GPI-GL-YFP apically. This was plotted based on model 1 using the kinetic parameters in Fig. 2 except that the peak fluorescence (normalization factor) was fitted to the data. The dimensions of the cell image (x, y, and z) are ∼10, 13, and 8 μm.
Figure 5.
Figure 5.
Quantification of GPI-GL-YFP and NgCAM-GFP transyctosis. (A) Cells were transfected with TGN38-CFP (green) and GPI-GL-YFP overnight and incubated with unconjugated anti-GFP antibody added to the apical (AP) and basal (BL) media for 2 h. The cells were then chased from 30 min with a blue antibody–conjugated anti-GFP added only to the basal medium. After washing, the cells were transferred to ice, and a red antibody–conjugated anti-GFP was added to the apical medium to detect free GPI-GL-YFP molecules. Complete 3D datasets were collected, and axial cross section images of representative cells are shown. Apical GPI-GL-YFP was poorly labeled by the blue antibody and heavily labeled by the red antibody, suggesting that few GPI-GL-YFP molecules ever gained access to the basal medium. Note that images acquired before and after chase represent different cells. Solid arrows illustrate the major route or transport, whereas dotted arrows illustrate the minor or insignificant routes. (B) Cells were transfected with NgCAM-GFP and were treated as in A except using an antibody to the NgCAM extracellular domain and that chase times were for 90 min. In this case, apical NgCAM was significantly labeled by the blue antibody, which was encountered in the basal medium. The absence of red antibody binding indicated that few free NgCAM molecules were accessible, suggesting that most of the NgCAM reached the apical surface after first appearing at the basolateral surface. Note that images acquired before and after chase represent different cells. Bar, 2 μm. (C) Based on quantification of the amount of antibody labeling on the apical domain, the percentage of GPI-GL-YFP and NgCAM-GFP that had been exposed to the basolateral domain was measured. For GPI-GL-YFP, two different antibody-labeling concentrations were used to ensure saturation.

Comment in

References

    1. Anderson, E., S. Maday, J. Sfakianos, M. Hull, B. Winckler, D. Sheff, H. Folsch, and I. Mellman. 2005. Transcytosis of NgCAM in epithelial cells reflects differential signal recognition on the endocytic and secretory pathways. J. Cell Biol. 170:595–605. - PMC - PubMed
    1. Ang, A.L., H. Folsch, U.M. Koivisto, M. Pypaert, and I. Mellman. 2003. The Rab8 GTPase selectively regulates AP-1B-dependent basolateral transport in polarized Madin-Darby canine kidney cells. J. Cell Biol. 163:339–350. - PMC - PubMed
    1. Ang, A.L., T. Taguchi, S. Francis, H. Folsch, L.J. Murrells, M. Pypaert, G. Warren, and I. Mellman. 2004. Recycling endosomes can serve as intermediates during transport from the Golgi to the plasma membrane of MDCK cells. J. Cell Biol. 167:531–543. - PMC - PubMed
    1. Bartles, J.R., H.M. Feracci, B. Stieger, and A.L. Hubbard. 1987. Biogenesis of the rat hepatocyte plasma membrane in vivo: comparison of the pathways taken by apical and basolateral proteins using subcellular fractionation. J. Cell Biol. 105:1241–1251. - PMC - PubMed
    1. Brown, P.S., E. Wang, B. Aroeti, S.J. Chapin, K.E. Mostov, and K.W. Dunn. 2000. Definition of distinct compartments in polarized Madin-Darby canine kidney (MDCK) cells for membrane-volume sorting, polarized sorting and apical recycling. Traffic. 1:124–140. - PubMed

Publication types

MeSH terms