. 2006 Apr 4;103(14):5573-8.
doi: 10.1073/pnas.0601279103. Epub 2006 Mar 27.

Reelin expression and glycosylation patterns are altered in Alzheimer's disease

Affiliations

Reelin expression and glycosylation patterns are altered in Alzheimer's disease

Arancha Botella-López et al. Proc Natl Acad Sci U S A. .

Abstract

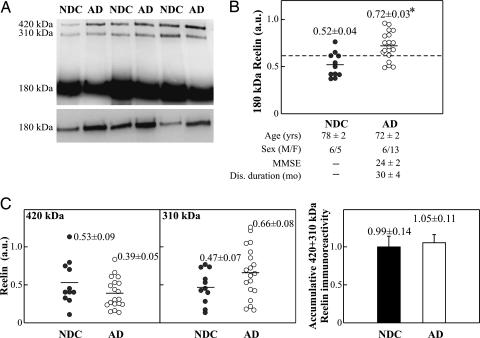
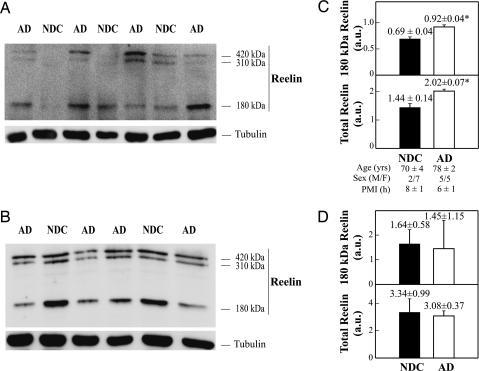
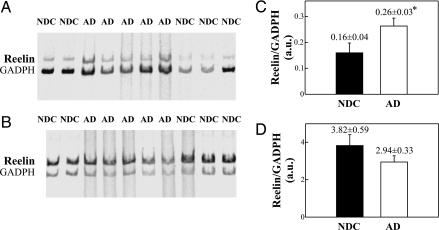
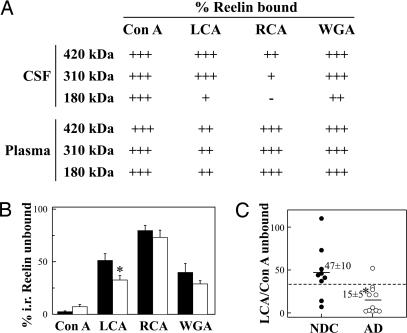
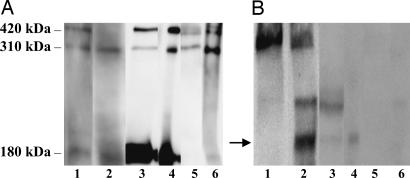
Reelin is a glycoprotein that is essential for the correct cytoarchitectonic organization of the developing CNS. Its function in the adult brain is less understood, although it has been proposed that Reelin is involved in signaling pathways linked to neurodegeneration. Here we analyzed Reelin expression in brains and cerebrospinal fluid (CSF) from Alzheimer's disease (AD) patients and nondemented controls. We found a 40% increase in the Reelin protein levels in the cortex of AD patients compared with controls. Similar increases were detected at the Reelin mRNA transcriptional level. This expression correlates with parallel increases in CSF but not in plasma samples. Next, we examined whether CSF Reelin levels were also altered in neurological diseases, including frontotemporal dementia, progressive supranuclear palsy, and Parkinson's disease. The Reelin 180-kDa band increased in all of the neurodegenerative disorders analyzed. Moreover, the 180-kDa Reelin levels correlated positively with Tau protein in CSF. Finally, we studied the pattern of Reelin glycosylation by using several lectins and the anti-HNK-1 antibody. Glycosylation differed in plasma and CSF. Furthermore, the pattern of Reelin lectin binding differed between the CSF of controls and in AD. Our results show that Reelin is up-regulated in the brain and CSF in several neurodegenerative diseases and that CSF and plasma Reelin have distinct cellular origins, thereby supporting that Reelin is involved in the pathogenesis of a number of neurodegenerative diseases.


Conflict of interest statement

Conflict of interest statement: No conflicts declared.

Figures

Fig. 1.
Fig. 1.
Immunodetection of CSF Reelin. (A) Representative blot of Reelin in CSF samples from AD and NDC. (B) Scatter plots for 180-kDa Reelin. The dashed line represents an arbitrary cutoff (0.62 arbitrary units). The data represent the means ± SE (determinations by duplicate). MMSE, MiniMental State Examination (see Supporting Text). ∗, Significantly different (P < 0.05) from the NDC group as assessed by Student’s t test. Immunoreactive bands are also shown. (C) Scatter plots for the full-length 420-kDa and 310-kDa Reelin fragments. Because the predominant 180-kDa band displayed greater immunoreactivity than the 410-kDa and 320-kDa fragments, semiquantitative analysis of all the fragments was performed over a range of exposure times to avoid loss of linearity during the long exposure times required for the detection of the large fragments. Accumulative immunoreactivity from the sum of higher-molecular-mass Reelin bands is also shown.
Fig. 2.
Fig. 2.
Concentrations and gel mobility for Reelin fragments in AD and NDC brain. (A and B) Three Reelin bands at 420, 310, and 180 kDa in frontal cortex (A) and cerebellum extracts (B). In each determination (made in triplicate) protein was adjusted to ≈20 μg by lane, and α-tubulin (1:1,000; Sigma) immunoreactive intensity was used as a control of blotting efficiency (Lower). (C and D) Reelin immunoreactivity from the 180-kDa fragment, and accumulative from the three Reelin bands, for NDC and AD subjects in frontal cortex (C) and cerebellum (D). In one NDC sample, no higher-molecular-mass Reelin fragments were detected and estimated in frontal cortex. The data represent the means ± SE (determinations by duplicate). ∗, Significantly different (P < 0.05) from the NDC group.
Fig. 3.
Fig. 3.
RNA expression in AD cerebral tissue. (A and B) RT-PCR-amplified cDNAs of Reelin and GAPDH from frontal cortex (A) and cerebellum (B) extracts were mixed in a single tube and electrophoretically separated in 4% acrylamide gels. The amplified bands were identifed according to their sizes (513 bp for Reelin cDNA and 444 bp for GAPDH cDNA) and developed by Typhoon 8600 scanning. (C and D) Densitometric quantitation of the Reelin/GAPDH ratio of RNA expression from frontal cortex (C) and cerebellar extracts (D). ∗, Significantly different (P < 0.05) from the NDC group.
Fig. 4.
Fig. 4.
Glycosylation of Reelin in CSF and plasma. (A) Five nonpathological CSF and plasma samples were incubated with immobilized lectins Con A, LCA, WGA, and RCA. Attempts to assay the Reelin bound to each lectin by resuspending and boiling the resin showed only 60–80% of recovery of the glycoprotein. The unbound Reelin, assayed by Western blotting, in the supernatant fraction was therefore used to compare differences in lectin binding between groups. The data represent the percentages of bound Reelin calculated after subtraction of unbound immunoreactivity for each band. We grouped values into four categories: +++, 75–100% of Reelin binding to lectin; ++, 50–74% binding; +, 25–49% binding; −, 0–24% binding. (B) Lectin binding of 180-kDa Reelin in gender- and age-matched CSF samples for 9 NDC and 11 AD subjects. (C) Scatter plots for the 180-kDa Reelin LCA/Con A ratio (% 180-kDa Reelin unbound to LCA/% 180-kDa Reelin unbound to Con A). The dashed line represents an arbitrary cutoff that maximally discriminated between AD and NDC groups (≈35 arbitrary units). The data represent the means ± SE. ∗, Significantly different (P < 0.05) from the NDC group as assessed by Student’s t test.
Fig. 5.
Fig. 5.
Reelin carries the HNK-1 carbohydrate. Reelin from frontal cortex (lane 1), CSF (lane 3), and plasma samples (lane 5) was immunoprecipitated by using the G10 antibody (lanes 2, 4, and 6). The experiments were repeated three times. Western blot analyses were performed by using 142 (anti-Reelin; A) and Ab2 (anti-HNK-1; B) antibodies. B shows the immunoreactivity of the 180-kDa cortical frontex (lane 2) for HNK-1 and more weakly for CSF-Reelin (lane 4). In contrast, no HNK-1 band was detected in Reelin immunoprecipitated from plasma (lane 6).

References

    1. D’Arcangelo G., Homayouni R., Keshvara L., Rice D. S., Sheldon M., Curran T. Neuron. 1999;24:471–479. - PubMed
    1. Hiesberger T., Trommsdorff M., Howell B. W., Goffinet A., Mumby M. C., Cooper J. A., Herz J. Neuron. 1999;24:481–489. - PubMed
    1. Bar I., Goffinet A. M. Nature. 1999;399:645–646. - PubMed
    1. Cooper J. A., Howell B. W. Cell. 1999;97:671–674. - PubMed
    1. Trommsdorff M., Gotthardt M., Hiesberger T., Shelton J., Stockinger W., Nimpf J., Hammer R. E., Richardson J. A., Herz J. Cell. 1999;97:689–701. - PubMed

Publication types

MeSH terms