

Transfer characteristics of the hair cell's afferent synapse
- PMID: 16567618
- PMCID: PMC1414630
- DOI: 10.1073/pnas.0601103103
Transfer characteristics of the hair cell's afferent synapse
Abstract
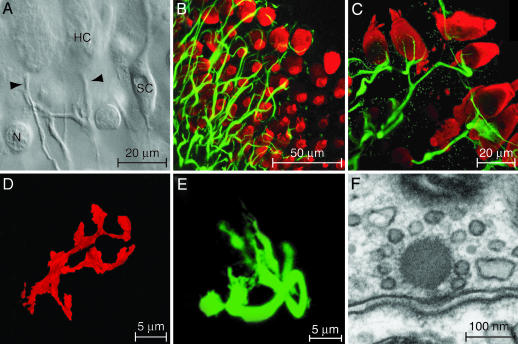
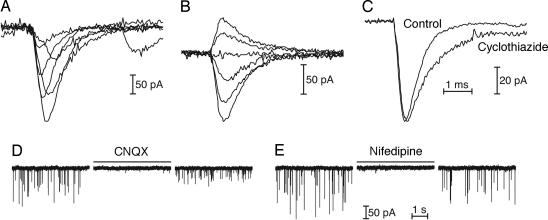
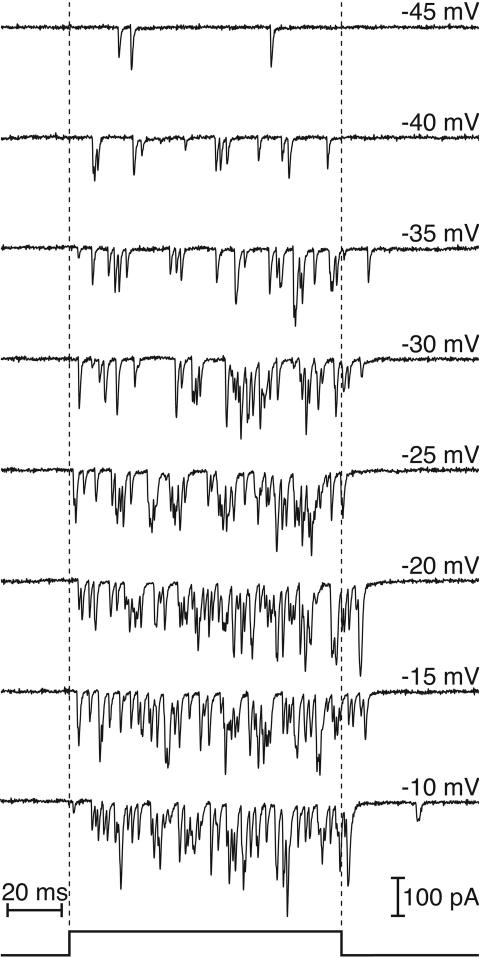
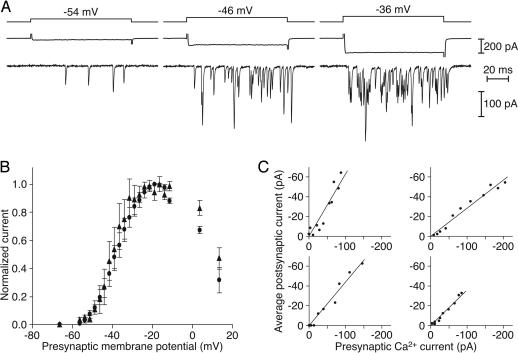
The sense of hearing depends on fast, finely graded neurotransmission at the ribbon synapses connecting hair cells to afferent nerve fibers. The processing that occurs at this first chemical synapse in the auditory pathway determines the quality and extent of the information conveyed to the central nervous system. Knowledge of the synapse's input-output function is therefore essential for understanding how auditory stimuli are encoded. To investigate the transfer function at the hair cell's synapse, we developed a preparation of the bullfrog's amphibian papilla. In the portion of this receptor organ representing stimuli of 400-800 Hz, each afferent nerve fiber forms several synaptic terminals onto one to three hair cells. By performing simultaneous voltage-clamp recordings from presynaptic hair cells and postsynaptic afferent fibers, we established that the rate of evoked vesicle release, as determined from the average postsynaptic current, depends linearly on the amplitude of the presynaptic Ca(2+) current. This result implies that, for receptor potentials in the physiological range, the hair cell's synapse transmits information with high fidelity.
Conflict of interest statement
Conflict of interest statement: No conflicts declared.
Figures

Similar articles
-
Hair Cell Afferent Synapses: Function and Dysfunction.Cold Spring Harb Perspect Med. 2019 Dec 2;9(12):a033175. doi: 10.1101/cshperspect.a033175. Cold Spring Harb Perspect Med. 2019. PMID: 30617058 Free PMC article. Review.
-
Frequency-selective exocytosis by ribbon synapses of hair cells in the bullfrog's amphibian papilla.J Neurosci. 2012 Sep 26;32(39):13433-8. doi: 10.1523/JNEUROSCI.1246-12.2012. J Neurosci. 2012. PMID: 23015434 Free PMC article.
-
Synaptic studies inform the functional diversity of cochlear afferents.Hear Res. 2015 Dec;330(Pt A):18-25. doi: 10.1016/j.heares.2015.09.007. Epub 2015 Sep 25. Hear Res. 2015. PMID: 26403507 Free PMC article.
-
Structure and function of the hair cell ribbon synapse.J Membr Biol. 2006 Feb-Mar;209(2-3):153-65. doi: 10.1007/s00232-005-0854-4. Epub 2006 May 25. J Membr Biol. 2006. PMID: 16773499 Free PMC article. Review.
-
Cationic influences upon synaptic transmission at the hair cell-afferent fiber synapse of the frog.Neuroscience. 1995 Oct;68(4):1147-65. doi: 10.1016/0306-4522(95)00200-3. Neuroscience. 1995. PMID: 8544989
Cited by
-
Time course and calcium dependence of transmitter release at a single ribbon synapse.Proc Natl Acad Sci U S A. 2007 Oct 9;104(41):16341-6. doi: 10.1073/pnas.0705756104. Epub 2007 Oct 2. Proc Natl Acad Sci U S A. 2007. PMID: 17911259 Free PMC article.
-
Hearing requires otoferlin-dependent efficient replenishment of synaptic vesicles in hair cells.Nat Neurosci. 2010 Jul;13(7):869-76. doi: 10.1038/nn.2578. Epub 2010 Jun 20. Nat Neurosci. 2010. PMID: 20562868
-
The Transfer Characteristics of Hair Cells Encoding Mechanical Stimuli in the Lateral Line of Zebrafish.J Neurosci. 2019 Jan 2;39(1):112-124. doi: 10.1523/JNEUROSCI.1472-18.2018. Epub 2018 Nov 9. J Neurosci. 2019. PMID: 30413644 Free PMC article.
-
Proton-mediated block of Ca2+ channels during multivesicular release regulates short-term plasticity at an auditory hair cell synapse.J Neurosci. 2014 Nov 26;34(48):15877-87. doi: 10.1523/JNEUROSCI.2304-14.2014. J Neurosci. 2014. PMID: 25429130 Free PMC article.
-
Models of utricular bouton afferents: role of afferent-hair cell connectivity in determining spike train regularity.J Neurophysiol. 2017 May 1;117(5):1969-1986. doi: 10.1152/jn.00895.2016. Epub 2017 Feb 15. J Neurophysiol. 2017. PMID: 28202575 Free PMC article.
References
Publication types
MeSH terms
Substances
Grants and funding
LinkOut - more resources
Full Text Sources
Other Literature Sources
Miscellaneous
