

Physically realistic homology models built with ROSETTA can be more accurate than their templates
- PMID: 16567638
- PMCID: PMC1459360
- DOI: 10.1073/pnas.0509355103
Physically realistic homology models built with ROSETTA can be more accurate than their templates
Abstract
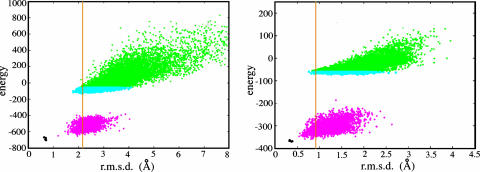
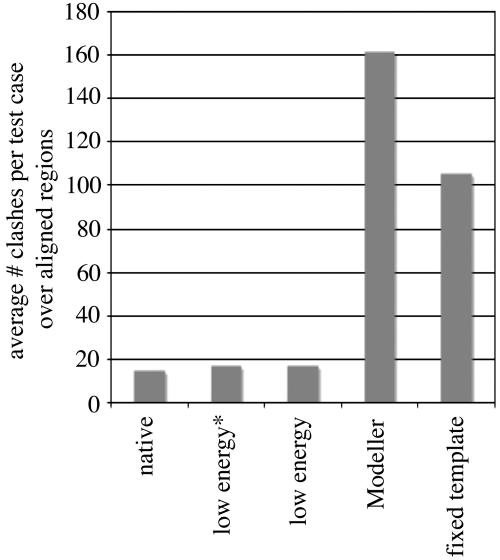
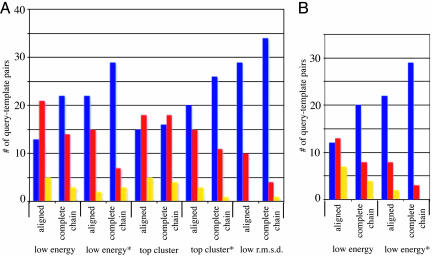
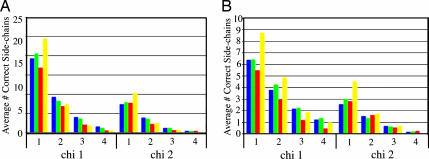
We have developed a method that combines the ROSETTA de novo protein folding and refinement protocol with distance constraints derived from homologous structures to build homology models that are frequently more accurate than their templates. We test this method by building complete-chain models for a benchmark set of 22 proteins, each with 1 or 2 candidate templates, for a total of 39 test cases. We use structure-based and sequence-based alignments for each of the test cases. All atoms, including hydrogens, are represented explicitly. The resulting models contain approximately the same number of atomic overlaps as experimentally determined crystal structures and maintain good stereochemistry. The most accurate models can be identified by their energies, and in 22 of 39 cases a model that is more accurate than the template over aligned regions is one of the 10 lowest-energy models.
Conflict of interest statement
Conflict of interest statement: No conflicts declared.
Figures
Similar articles
-
Improving physical realism, stereochemistry, and side-chain accuracy in homology modeling: Four approaches that performed well in CASP8.Proteins. 2009;77 Suppl 9(Suppl 9):114-22. doi: 10.1002/prot.22570. Proteins. 2009. PMID: 19768677 Free PMC article.
-
High-resolution comparative modeling with RosettaCM.Structure. 2013 Oct 8;21(10):1735-42. doi: 10.1016/j.str.2013.08.005. Epub 2013 Sep 12. Structure. 2013. PMID: 24035711 Free PMC article.
-
Template-Guided Protein Structure Prediction and Refinement Using Optimized Folding Landscape Force Fields.J Chem Theory Comput. 2018 Nov 13;14(11):6102-6116. doi: 10.1021/acs.jctc.8b00683. Epub 2018 Oct 8. J Chem Theory Comput. 2018. PMID: 30240202 Free PMC article.
-
What method to use for protein-protein docking?Curr Opin Struct Biol. 2019 Apr;55:1-7. doi: 10.1016/j.sbi.2018.12.010. Epub 2019 Feb 1. Curr Opin Struct Biol. 2019. PMID: 30711743 Free PMC article. Review.
-
Templates in protein de novo design.J Biotechnol. 1995 Jul 31;41(2-3):197-210. doi: 10.1016/0168-1656(95)00010-n. J Biotechnol. 1995. PMID: 7654350 Review.
Cited by
-
Toward optimal fragment generations for ab initio protein structure assembly.Proteins. 2013 Feb;81(2):229-39. doi: 10.1002/prot.24179. Epub 2012 Oct 16. Proteins. 2013. PMID: 22972754 Free PMC article.
-
Molecular evolution of dihydrouridine synthases.BMC Bioinformatics. 2012 Jun 28;13:153. doi: 10.1186/1471-2105-13-153. BMC Bioinformatics. 2012. PMID: 22741570 Free PMC article.
-
Comparative protein structure modeling using Modeller.Curr Protoc Bioinformatics. 2006 Oct;Chapter 5:Unit-5.6. doi: 10.1002/0471250953.bi0506s15. Curr Protoc Bioinformatics. 2006. PMID: 18428767 Free PMC article.
-
Template-based protein structure prediction in CASP11 and retrospect of I-TASSER in the last decade.Proteins. 2016 Sep;84 Suppl 1(Suppl 1):233-46. doi: 10.1002/prot.24918. Epub 2015 Sep 18. Proteins. 2016. PMID: 26343917 Free PMC article.
-
Using RosettaLigand for small molecule docking into comparative models.PLoS One. 2012;7(12):e50769. doi: 10.1371/journal.pone.0050769. Epub 2012 Dec 11. PLoS One. 2012. PMID: 23239984 Free PMC article.
References
-
- Marti-Renom M. A., Stuart A. C., Fiser A., Sanchez R., Melo F., Sali A. Annu. Rev. Biophys. Biomol. Struct. 2000;29:291–325. - PubMed
-
- Tramontano A., Leplae R., Morea V. Proteins. 2001;(Suppl. 5):22–38. - PubMed
-
- Tramontano A., Morea V. Proteins. 2003;53(Suppl. 6):352–368. - PubMed
-
- Laskowski R. A., MacArthur M. W., Moss D. S., Thornton J. M. J. Appl. Cryst. 1993;26:291–294.
Publication types
MeSH terms
Substances
LinkOut - more resources
Full Text Sources
Other Literature Sources
