. 2006 Jun;7(2):125-39.
doi: 10.1007/s10162-006-0028-9. Epub 2006 Mar 28.

Simultaneous measurement of noise-activated middle-ear muscle reflex and stimulus frequency otoacoustic emissions

Affiliations

Simultaneous measurement of noise-activated middle-ear muscle reflex and stimulus frequency otoacoustic emissions

Shawn S Goodman et al. J Assoc Res Otolaryngol. 2006 Jun.

Abstract

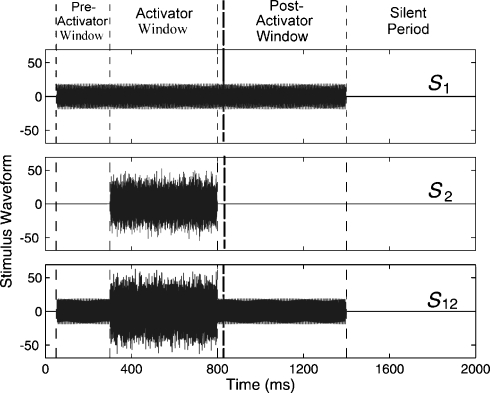
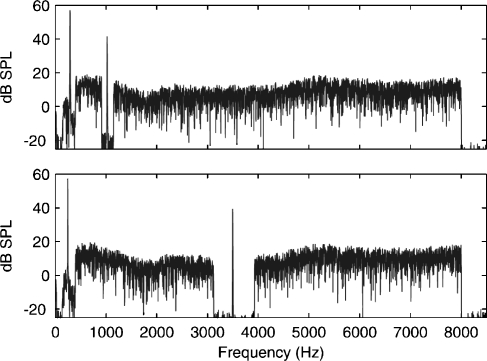
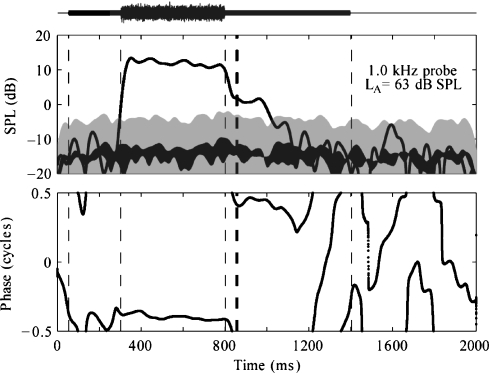
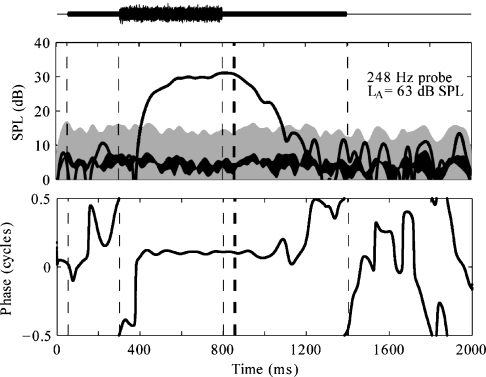
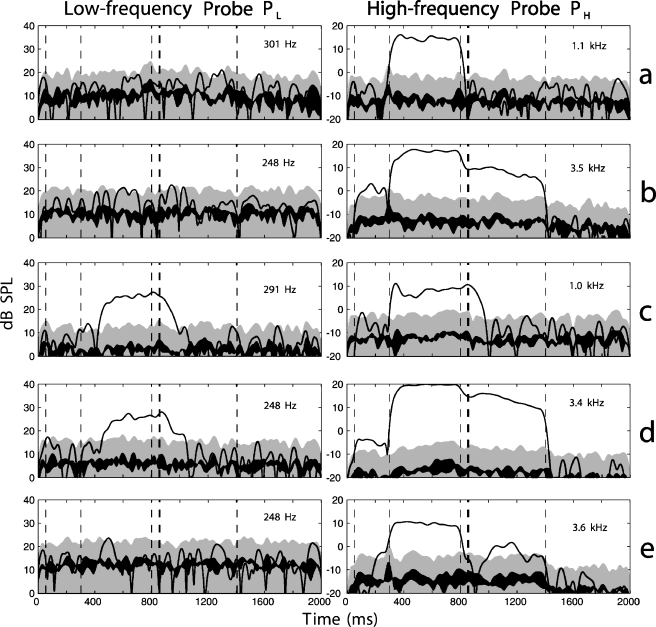
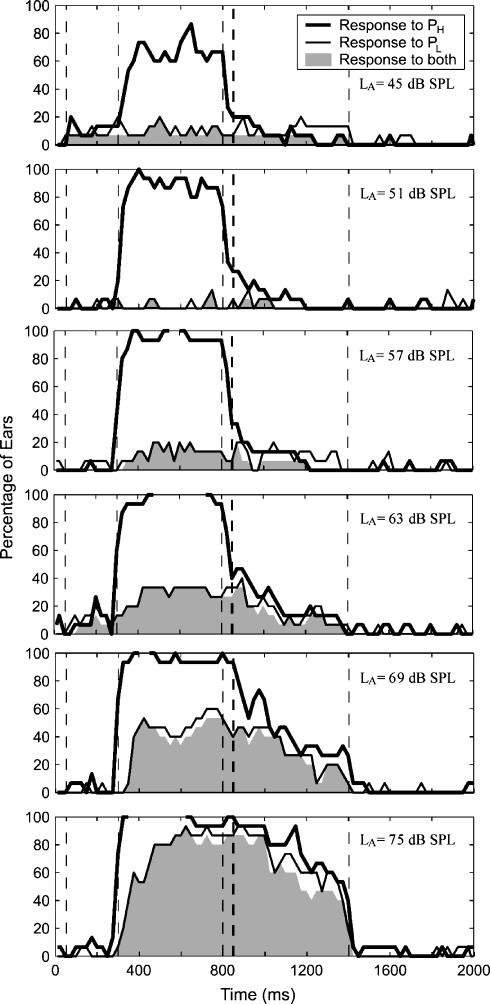
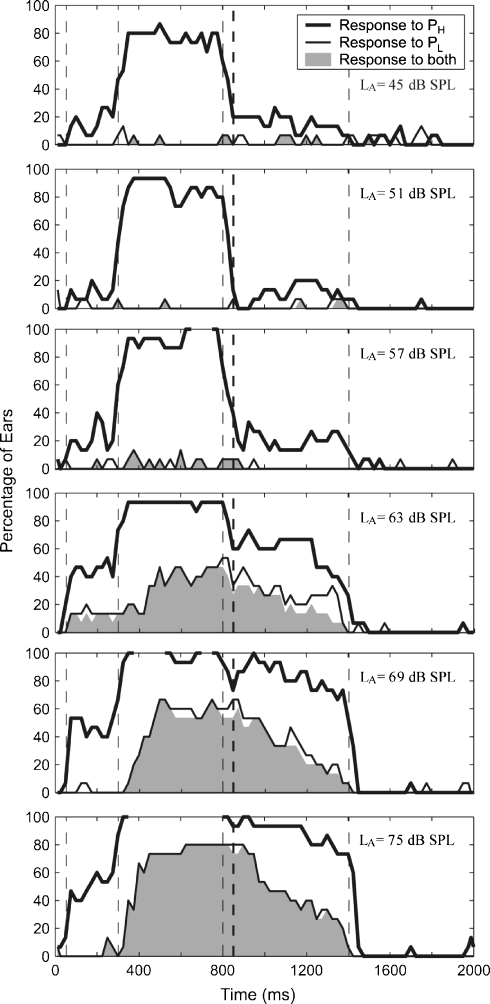
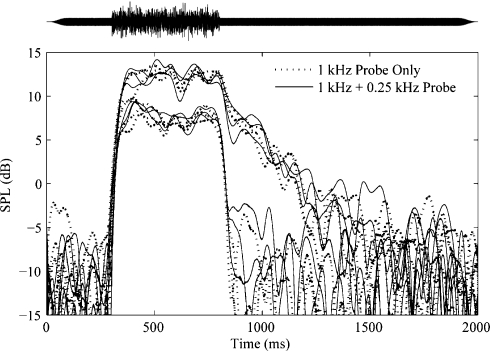
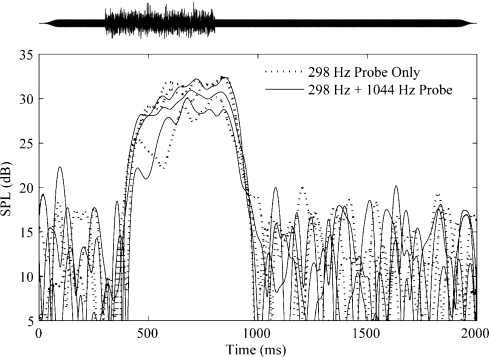
Otoacoustic emissions serve as a noninvasive probe of the medial olivocochlear (MOC) reflex. Stimulus frequency otoacoustic emissions (SFOAEs) elicited by a low-level probe tone may be the optimal type of emission for studying MOC effects because at low levels, the probe itself does not elicit the MOC reflex [Guinan et al. (2003) J. Assoc. Res. Otolaryngol. 4:521]. Based on anatomical considerations, the MOC reflex activated by ipsilateral acoustic stimulation (mediated by the crossed olivocochlear bundle) is predicted to be stronger than the reflex to contralateral stimulation. Broadband noise is an effective activator of the MOC reflex; however, it is also an effective activator of the middle-ear muscle (MEM) reflex, which can make results difficult to interpret. The MEM reflex may be activated at lower levels than measured clinically, and most previous human studies have not explicitly included measurements to rule out MEM reflex contamination. The current study addressed these issues using a higher-frequency SFOAE probe tone to test for cochlear changes mediated by the MOC reflex, while simultaneously monitoring the MEM reflex using a low-frequency probe tone. Broadband notched noise was presented ipsilaterally at various levels to elicit probe-tone shifts. Measurements are reported for 15 normal-hearing subjects. With the higher-frequency probe near 1.5 kHz, only 20% of subjects showed shifts consistent with an MOC reflex in the absence of an MEM-induced shift. With the higher-frequency probe near 3.5 kHz, up to 40% of subjects showed shifts in the absence of an MEM-induced shift. However, these responses had longer time courses than expected for MOC-induced shifts, and may have been dominated by other cochlear processes, rather than MOC reflex. These results suggest caution in the interpretation of effects observed using ipsilaterally presented acoustic activators intended to excite the MOC reflex.


Figures

Fig. 1
Fig. 1
Set of stimulus waveforms: s1 (top), s2 (middle), and s12 (bottom) were presented in separate stimulus intervals. Stimulus s1 consisted of a pair of sinusoidal probe tones gated on from 50 to 1350 ms; s2 was a short-duration (500 ms) activator noise; s12 was the joint presentation of s1 and s2. As indicated by vertical dashed lines in this and subsequent figures, the time period 50–299 ms is referred to as the “preactivator window,” the time period 300–800 ms is called the “activator window,” the time period 850–1350 ms is called the “postactivator window,” and 1351–2000 ms is called the “silent period.” The 50-ms delay between the end of the activator window (at 800 ms) and the beginning of the postactivator window (at 850 ms) allows for filter settling time and for cochlear suppression effects to die away. The vertical dashed line at the beginning of the postactivator period is drawn with a thicker line width in this and subsequent figures.
Fig 2
Fig 2
Sample stimulus spectra. Low-frequency probes PL were presented at 55 dB SPL and were located between 250 and 300 Hz. Spectra are shown, in which the high-frequency probe tones PH were presented at 40 dB SPL and were located near 1.5 kHz (top) or 3.5 kHz (bottom). The MOC activator was an electrically flat, notched noise with energy from 0.4 to 8 kHz. The notch was logarithmically centered at fH with varying notch widths and levels. The example shown is for an activator of 45 dB SPL with a notch width of 1/3 octave.
Fig 3
Fig 3
Empirical distribution functions (edfs) for SNR when no OAE is present. Solid line shows a numerical simulation, dotted line shows data recorded from a coupler, and dashed lines show data from a subject's ear (with the probe tone present but the activator absent).
Fig 4
Fig 4
SPL envelope (top panel) and phase (bottom panel) responses using PH = 1 kHz. Mean SPL is shown by black line of uniform width. The noise based on the SEM is shown by the black line of nonuniform thickness. The gray shaded area marks the detection criterion, the top of the shaded area being 10 dB above the noise. Vertical dashed lines mark the preactivator, activator, and postactivator windows.
Fig 5
Fig 5
SPL envelope (top panel) and phase (bottom panel) responses using PL = 250 Hz. Layout is as described in Figure 4.
Fig 6
Fig 6
SPL envelope responses as a function of time for individual subjects. Responses to low-frequency probe are shown in the left column; responses to high-frequency probe are shown in the right column. Noise floor (SEM) is shown as a black line. The 99% CI for the noise is shown by the upper edge of the gray shaded area. The fL and fH frequencies are labeled in each panel. All responses shown here are for LA = 63 dB SPL and NW= 1/6 octave.
Fig 7
Fig 7
Group results for PH = 1.5 kHz and NW = 1/6 octave. Percentage of ears with a response is shown as a function of time, calculated in 50-ms windows with 1/2 overlap. Panels show increasing activator level from top to bottom. Thick line represents percentage of ears with a response to the 1.5-kHz probe tone. Thin line shows percentage of ears with a response to the low-frequency probe tone. Gray area shows percentage of ears with a response to both probes simultaneously. Responses are arranged from top to bottom in order of increasing activator level.
Fig 8
Fig 8
Group results for PH = 3.5 kHz and NW = 1/6 octave. The layout is as described in Figure 7.
Fig 9
Fig 9
Representative pilot data from one subject at fH for two noise activator levels. Results obtained using PH alone (dotted lines) and PH + PL (solid lines) are shown. Three repetitions of each condition are shown for two activator levels. fH = 1044 Hz and fL = 298 Hz. PH was presented at a level of 37 dB SPL, and PL was presented at a level of 55 dB SPL. Activators were presented at LA = 60 and 72 dB SPL. Activator NW = 1/6 octave.
Fig 10
Fig 10
Representative pilot data from one subject at fL for one noise activator level. Results obtained using PL alone (dotted lines) and PL + PH (solid lines) are shown. Three repetitions of each condition are shown for LA = 68 dB SPL. Activator NW = 1/6 octave. Probe frequencies and levels were the same as in Figure 9.

Similar articles

Cited by

References

    1. {'text': '', 'ref_index': 1, 'ids': [{'type': 'DOI', 'value': '10.1016/0378-5955(93)90015-S', 'is_inner': False, 'url': 'https://doi.org/10.1016/0378-5955(93)90015-s'}, {'type': 'PubMed', 'value': '8113128', 'is_inner': True, 'url': 'https://pubmed.ncbi.nlm.nih.gov/8113128/'}]}
    2. Berlin CI, Hood LJ, Wen H, Szabo P, Cecola RP, Rigby P, Jackson DF. Contralateral suppression of non-linear click-evoked otoacoustic emissions. Hear. Res. 71:1–11, 1993. - PubMed
    1. {'text': '', 'ref_index': 1, 'ids': [{'type': 'DOI', 'value': '10.3109/00206098109072698', 'is_inner': False, 'url': 'https://doi.org/10.3109/00206098109072698'}, {'type': 'PubMed', 'value': '7213209', 'is_inner': True, 'url': 'https://pubmed.ncbi.nlm.nih.gov/7213209/'}]}
    2. Blood IM, Greenberg HJ. Low-level acoustic reflex thresholds. Audiology 20:244–250, 1981. - PubMed
    1. {'text': '', 'ref_index': 1, 'ids': [{'type': 'DOI', 'value': '10.1016/S0006-8993(99)02227-1', 'is_inner': False, 'url': 'https://doi.org/10.1016/s0006-8993(99)02227-1'}, {'type': 'PubMed', 'value': '10661505', 'is_inner': True, 'url': 'https://pubmed.ncbi.nlm.nih.gov/10661505/'}]}
    2. Buki B, Wit HP, Avan P. Olivocochlear efferent vs. middle-ear contributions to the alteration of otoacoustic emissions by contralateral noise. Brain Res. 852:140–150, 2000. - PubMed
    1. {'text': '', 'ref_index': 1, 'ids': [{'type': 'DOI', 'value': '10.1016/0378-5955(93)90239-W', 'is_inner': False, 'url': 'https://doi.org/10.1016/0378-5955(93)90239-w'}, {'type': 'PubMed', 'value': '8340262', 'is_inner': True, 'url': 'https://pubmed.ncbi.nlm.nih.gov/8340262/'}]}
    2. Burns EM, Harrison W, Bulen JC, Keefe DH. Voluntary contraction of middle ear muscles: effects on input impedance, energy reflectance, and spontaneous otoacoustic emissions. Hear. Res. 67:117–127, 1993. - PubMed
    1. {'text': '', 'ref_index': 1, 'ids': [{'type': 'DOI', 'value': '10.1016/0378-5955(90)90232-E', 'is_inner': False, 'url': 'https://doi.org/10.1016/0378-5955(90)90232-e'}, {'type': 'PubMed', 'value': '2312416', 'is_inner': True, 'url': 'https://pubmed.ncbi.nlm.nih.gov/2312416/'}]}
    2. Collet L, Kemp DT, Veuillet E, Duclaux R, Moulin A, Morgon A. Effect of contralateral auditory stimuli on active cochlear micro-mechanical properties in human subjects. Hear. Res. 43:251–262, 1990. - PubMed

Publication types

LinkOut - more resources