

In vitro and in vivo effects of the PPAR-alpha agonists fenofibrate and retinoic acid in endometrial cancer
- PMID: 16569247
- PMCID: PMC1475879
- DOI: 10.1186/1476-4598-5-13
In vitro and in vivo effects of the PPAR-alpha agonists fenofibrate and retinoic acid in endometrial cancer
Abstract
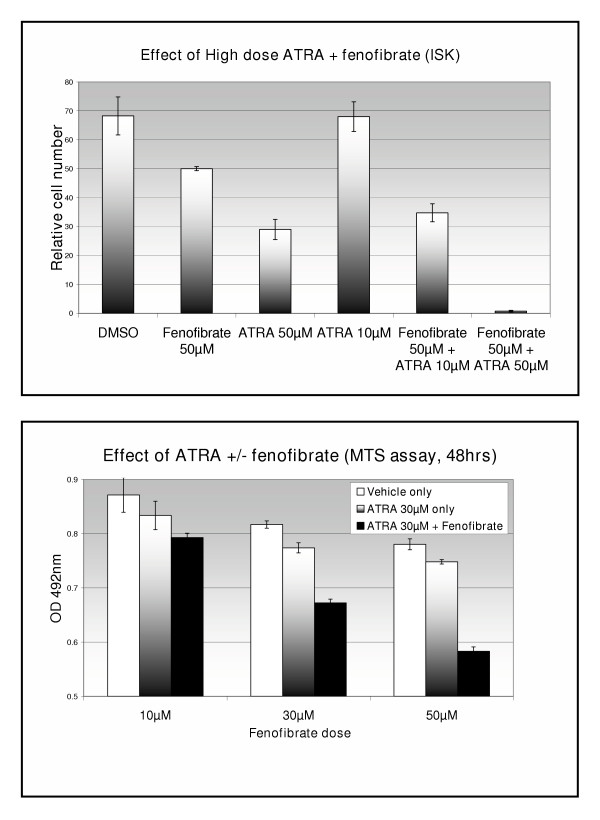
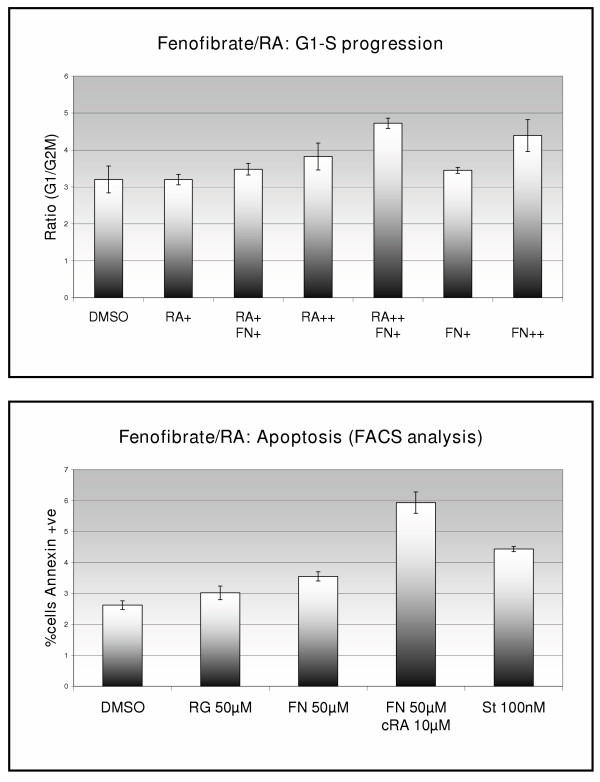
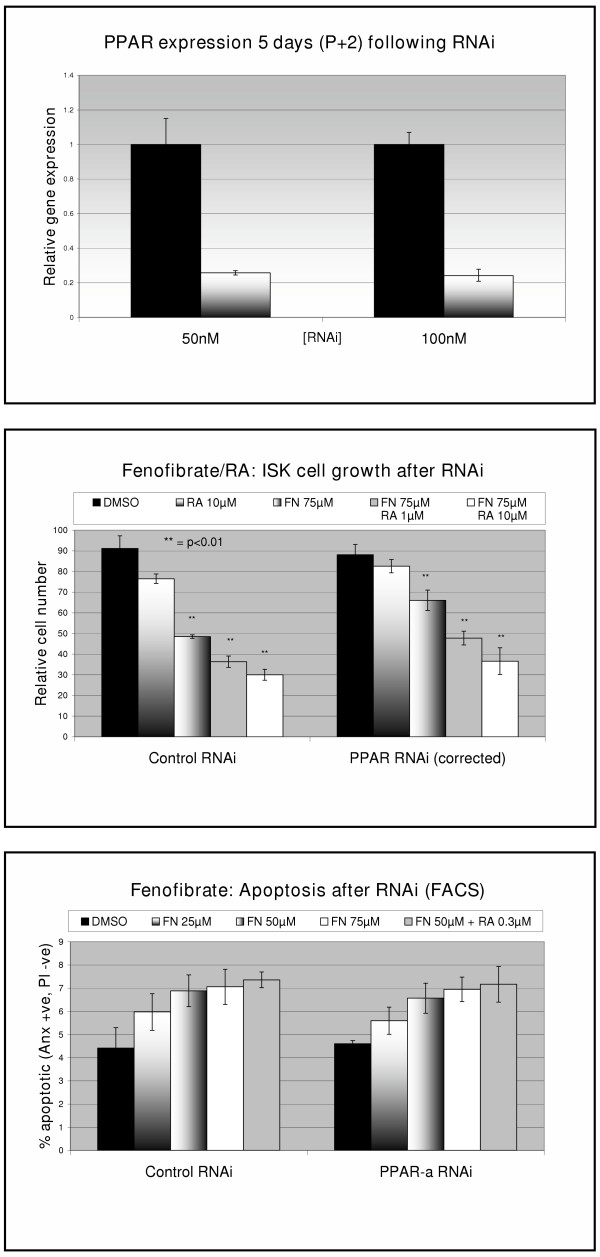
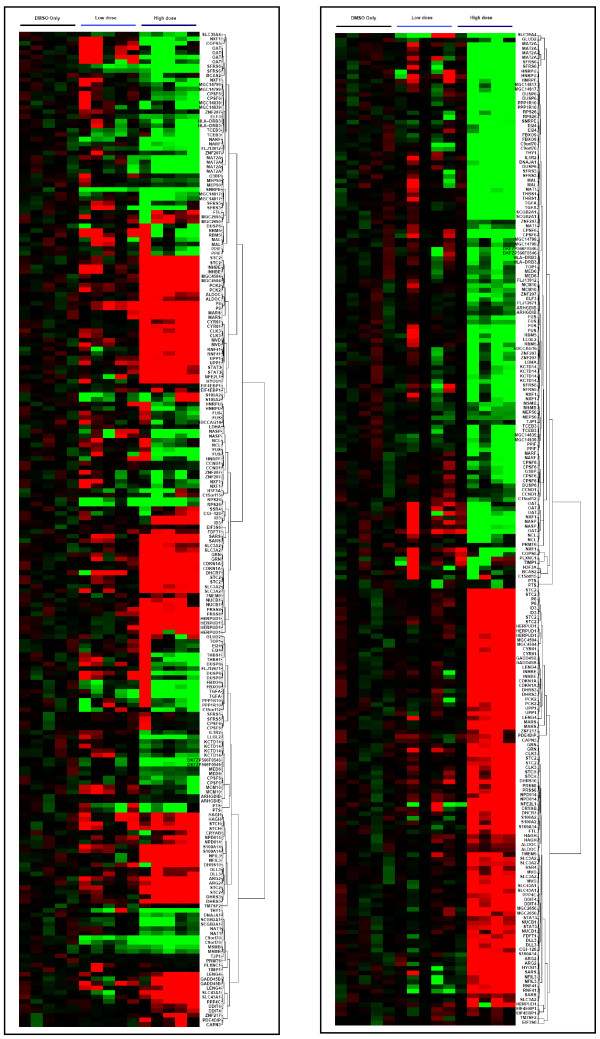
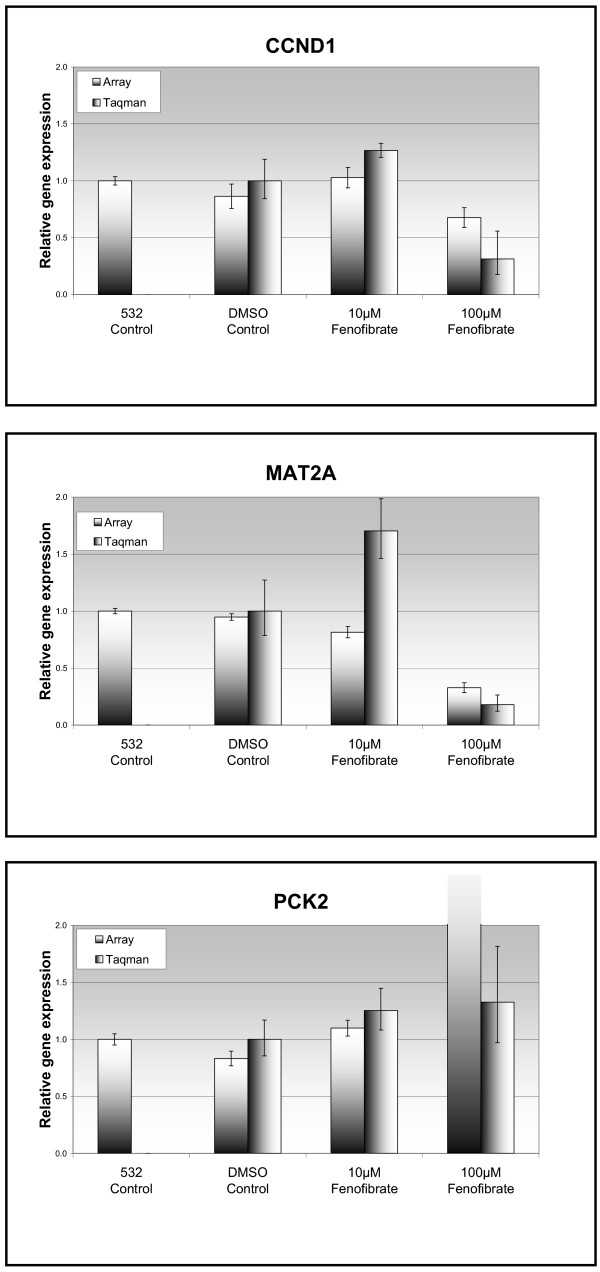
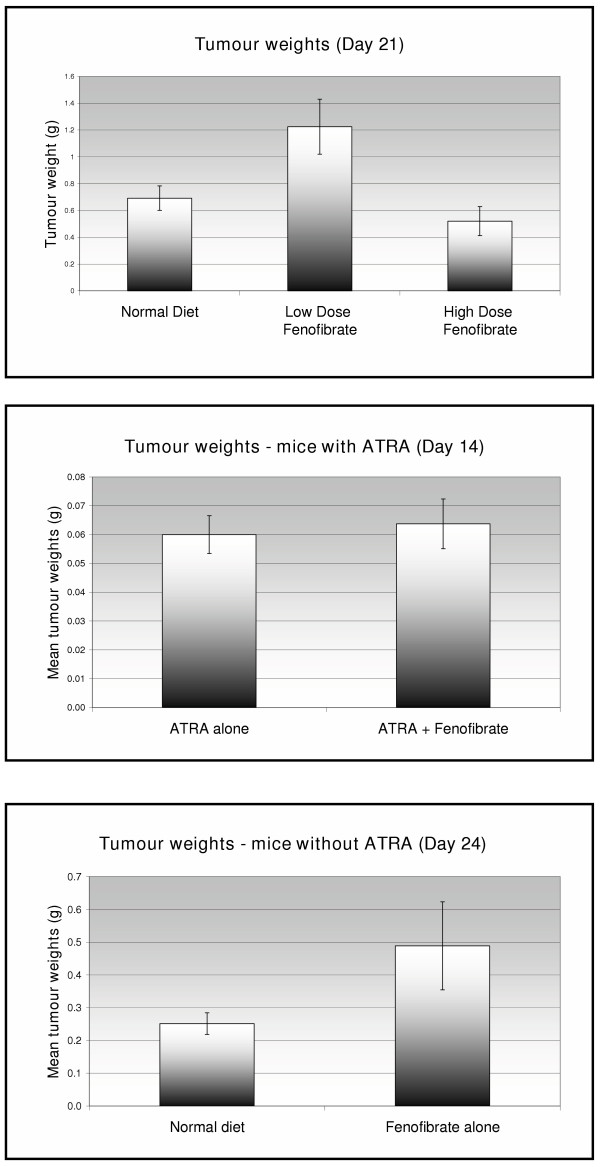
Fenofibrate, an agonist of PPAR-alpha, in doses above 25 microM, inhibits proliferation and induces apoptosis in Ishikawa endometrial cancer cells. We show that these effects are potentiated by retinoic acid, an agonist of the retinoid-X-receptor. DNA content analysis shows that G1/S phase progression through the cell cycle is inhibited. Independent Component Analysis of gene microarray experiments demonstrated downregulation of Cyclin D1 (CCND1) and associated changes in cell cycle gene expression. Expression of PPAR-alpha mRNA was reduced by >75% using RNA-interference but this resulted in only minor changes in biological effects. A nude mouse model of endometrial carcinoma was used to investigate the effect of fenofibrate in vivo but failed to show consistent inhibition of tumour growth.
Conclusion: The combination of fenofibrate and retinoic acid is a potent inhibitor of Ishikawa endometrial cancer cell growth in vitro.
Figures
Similar articles
-
Fenofibrate induces apoptosis of triple-negative breast cancer cells via activation of NF-κB pathway.BMC Cancer. 2014 Feb 16;14:96. doi: 10.1186/1471-2407-14-96. BMC Cancer. 2014. PMID: 24529079 Free PMC article.
-
Retinoic acid inhibits endometrial cancer cell growth via multiple genomic mechanisms.J Mol Endocrinol. 2011 Mar 23;46(2):139-53. doi: 10.1530/JME-10-0064. Print 2011 Apr. J Mol Endocrinol. 2011. PMID: 21310893 Free PMC article.
-
Fenofibrate induced PPAR alpha expression was attenuated by oestrogen receptor alpha overexpression in Hep3B cells.Environ Toxicol. 2018 Feb;33(2):234-247. doi: 10.1002/tox.22511. Epub 2017 Nov 14. Environ Toxicol. 2018. PMID: 29134746
-
Inhibitory effects of fenofibrate on apoptosis and cell proliferation in human endothelial cells in high glucose.J Mol Med (Berl). 2008 Feb;86(2):185-95. doi: 10.1007/s00109-007-0257-3. Epub 2007 Sep 18. J Mol Med (Berl). 2008. PMID: 17876565
-
Synergistic effects of acyclic retinoid and OSI-461 on growth inhibition and gene expression in human hepatoma cells.Clin Cancer Res. 2004 Oct 1;10(19):6710-21. doi: 10.1158/1078-0432.CCR-04-0659. Clin Cancer Res. 2004. PMID: 15475462
Cited by
-
Lipid profiles and the risk of endometrial cancer in the Swedish AMORIS study.Int J Mol Epidemiol Genet. 2012;3(2):122-33. Epub 2012 May 15. Int J Mol Epidemiol Genet. 2012. PMID: 22724049 Free PMC article.
-
Regulation of URG4/URGCP and PPARα gene expressions after retinoic acid treatment in neuroblastoma cells.Tumour Biol. 2013 Dec;34(6):3853-7. doi: 10.1007/s13277-013-0970-1. Epub 2013 Jul 3. Tumour Biol. 2013. PMID: 23821302
-
PPARα modulates gene expression profiles of mitochondrial energy metabolism in oral tumorigenesis.Biomedicine (Taipei). 2016 Mar;6(1):3. doi: 10.7603/s40681-016-0003-7. Epub 2016 Feb 10. Biomedicine (Taipei). 2016. PMID: 26869356 Free PMC article.
-
Identification of a Difluorinated Alkoxy Sulfonyl Chloride as a Novel Antitumor Agent for Hepatocellular Carcinoma through Activating Fumarate Hydratase Activity.Pharmaceuticals (Basel). 2023 Dec 8;16(12):1705. doi: 10.3390/ph16121705. Pharmaceuticals (Basel). 2023. PMID: 38139831 Free PMC article.
-
A CD47-associated super-enhancer links pro-inflammatory signalling to CD47 upregulation in breast cancer.Nat Commun. 2017 Apr 5;8:14802. doi: 10.1038/ncomms14802. Nat Commun. 2017. PMID: 28378740 Free PMC article.
References
-
- Ferlay J, Bray F, Pisani P, Parkin DM. GLOBOCAN 2002: Cancer Incidence, Mortality and Prevalence Worldwide, IARC CancerBase No. 5. version 2.0. IARCPress, Lyon; 2004. http://www-dep.iarc.fr/
-
- Kaaks R, Lukanova A, et al. Obesity, endogenous hormones, and endometrial cancer risk: a synthetic review. Cancer Epidemiol Biomarkers Prev. 2002;11:1531–43. - PubMed
Publication types
MeSH terms
Substances
Grants and funding
LinkOut - more resources
Full Text Sources
Research Materials
