Phylogenetic fate mapping
- PMID: 16569691
- PMCID: PMC1414797
- DOI: 10.1073/pnas.0601265103
Phylogenetic fate mapping
Abstract
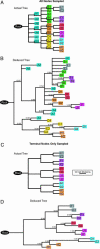
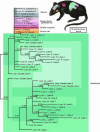
Cell fate maps describe how the sequence of cell division, migration, and apoptosis transform a zygote into an adult. Yet, it is only in Caenorhabditis elegans where microscopic observation of each cell division has allowed for construction of a complete fate map. More complex, and opaque, animals prove less yielding. DNA replication, however, generates somatic mutations. Consequently, multicellular organisms comprise mosaics where most cells acquire unique genomes that are potentially capable of delineating their ancestry. Here we take a phylogenetic approach to passively retrace embryonic relationships by deducing the order in which mutations have arisen during development. We show that polyguanine repeat DNA sequences are particularly useful genetic markers, because they frequently change length during mitosis. To demonstrate feasibility, we phylogenetically reconstruct the lineage of cultured mouse NIH 3T3 cells based on mutations affecting the length of polyguanine markers. We then employ whole genome amplification to genotype polyguanine markers in single cells taken from a mouse and use phylogenetics to infer the developmental relationships of the sampled tissues. The result is consistent with the present understanding of embryogenesis and demonstrates the large scale potential of this method for producing a complete mammalian cell fate at the resolution of a single cell.
Conflict of interest statement
Conflict of interest statement: No conflicts declared.
Figures


Similar articles
-
A phylogenetic approach to mapping cell fate.Curr Top Dev Biol. 2007;79:157-84. doi: 10.1016/S0070-2153(06)79006-8. Curr Top Dev Biol. 2007. PMID: 17498550 Review.
-
Phylogenetic analysis of developmental and postnatal mouse cell lineages.Evol Dev. 2010 Jan-Feb;12(1):84-94. doi: 10.1111/j.1525-142X.2009.00393.x. Evol Dev. 2010. PMID: 20156285 Free PMC article.
-
Phylogenetic fate mapping: theoretical and experimental studies applied to the development of mouse fibroblasts.Genetics. 2008 Feb;178(2):967-77. doi: 10.1534/genetics.107.081018. Epub 2008 Feb 3. Genetics. 2008. PMID: 18245843 Free PMC article.
-
Use of somatic mutations to quantify random contributions to mouse development.BMC Genomics. 2013 Jan 18;14:39. doi: 10.1186/1471-2164-14-39. BMC Genomics. 2013. PMID: 23327737 Free PMC article.
-
The Caenorhabditis elegans gonad: a test tube for cell and developmental biology.Dev Dyn. 2000 May;218(1):2-22. doi: 10.1002/(SICI)1097-0177(200005)218:1<2::AID-DVDY2>3.0.CO;2-W. Dev Dyn. 2000. PMID: 10822256 Review.
Cited by
-
Single-cell sequencing-based technologies will revolutionize whole-organism science.Nat Rev Genet. 2013 Sep;14(9):618-30. doi: 10.1038/nrg3542. Epub 2013 Jul 30. Nat Rev Genet. 2013. PMID: 23897237 Review.
-
Comparing algorithms that reconstruct cell lineage trees utilizing information on microsatellite mutations.PLoS Comput Biol. 2013;9(11):e1003297. doi: 10.1371/journal.pcbi.1003297. Epub 2013 Nov 14. PLoS Comput Biol. 2013. PMID: 24244121 Free PMC article.
-
Inferring cell differentiation processes based on phylogenetic analysis of genome-wide epigenetic information: hematopoiesis as a model case.Genome Biol Evol. 2015 Jan 31;7(3):699-705. doi: 10.1093/gbe/evv024. Genome Biol Evol. 2015. PMID: 25638259 Free PMC article.
-
A programmable sequence of reporters for lineage analysis.Nat Neurosci. 2020 Dec;23(12):1618-1628. doi: 10.1038/s41593-020-0676-9. Epub 2020 Jul 27. Nat Neurosci. 2020. PMID: 32719561
-
Deep Residual Neural Networks Resolve Quartet Molecular Phylogenies.Mol Biol Evol. 2020 May 1;37(5):1495-1507. doi: 10.1093/molbev/msz307. Mol Biol Evol. 2020. PMID: 31868908 Free PMC article.
References
-
- Sulston J. E., Schierenberg E., White J. G., Thomson J. N. Dev. Biol. 1983;100:64–119. - PubMed
-
- Clarke J. D., Tickle C. Nat. Cell Biol. 1999;1:E103–E109. - PubMed
-
- Stern C. D., Fraser S. E. Nat. Cell Biol. 2001;3:E216–E218. - PubMed
-
- Bowen J., Hinchliffe J. R., Horder T. J., Reeve A. M. Anat. Embryol. 1989;179:269–283. - PubMed
-
- Honig M. G., Hume R. I. Trends Neurosci. 1989;12:333–335. 340–341. - PubMed
Publication types
MeSH terms
Grants and funding
LinkOut - more resources
Full Text Sources
Other Literature Sources

