. 2006 Apr 4;103(14):5320-5.
doi: 10.1073/pnas.0601091103. Epub 2006 Mar 28.

A high-resolution map of transcription in the yeast genome

Affiliations

A high-resolution map of transcription in the yeast genome

Lior David et al. Proc Natl Acad Sci U S A. .

Abstract

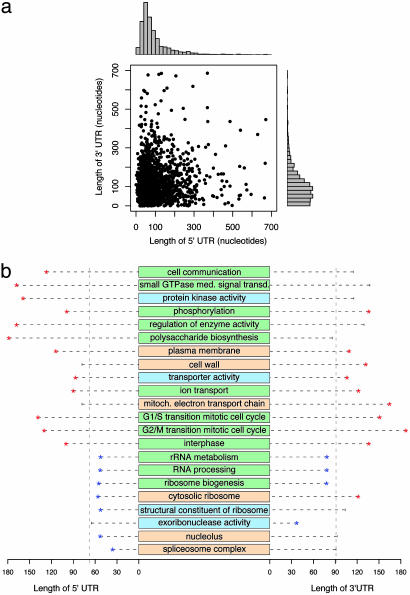
There is abundant transcription from eukaryotic genomes unaccounted for by protein coding genes. A high-resolution genome-wide survey of transcription in a well annotated genome will help relate transcriptional complexity to function. By quantifying RNA expression on both strands of the complete genome of Saccharomyces cerevisiae using a high-density oligonucleotide tiling array, this study identifies the boundary, structure, and level of coding and noncoding transcripts. A total of 85% of the genome is expressed in rich media. Apart from expected transcripts, we found operon-like transcripts, transcripts from neighboring genes not separated by intergenic regions, and genes with complex transcriptional architecture where different parts of the same gene are expressed at different levels. We mapped the positions of 3' and 5' UTRs of coding genes and identified hundreds of RNA transcripts distinct from annotated genes. These nonannotated transcripts, on average, have lower sequence conservation and lower rates of deletion phenotype than protein coding genes. Many other transcripts overlap known genes in antisense orientation, and for these pairs global correlations were discovered: UTR lengths correlated with gene function, localization, and requirements for regulation; antisense transcripts overlapped 3' UTRs more than 5' UTRs; UTRs with overlapping antisense tended to be longer; and the presence of antisense associated with gene function. These findings may suggest a regulatory role of antisense transcription in S. cerevisiae. Moreover, the data show that even this well studied genome has transcriptional complexity far beyond current annotation.


Conflict of interest statement

Conflict of interest statement: No conflicts declared.

Figures

Fig. 1.
Fig. 1.
Visualization of yeast tiling array intensities along 100 kb of chromosome 1, corresponding to ≈1% of the genome. The plot shows the normalized hybridization intensities (y axis) along genomic coordinates (x axis in bp). Each dot corresponds to a probe, Watson strand in green and Crick strand in blue. Probes with more than one perfect match in the genome are colored gray. Annotated ORFs are shown as blue boxes, dubious ORFs are shown as light blue boxes, and transcription factor binding sites are shown as gray bars. Vertical lines are segment boundaries. The background threshold (y = 0) is shown as a horizontal line.
Fig. 2.
Fig. 2.
Examples of transcriptional architecture. (a) Detection of spliced transcripts. (b) Long 5′ UTR of GCN4 including its cotranscribed upstream ORFs. (c) Complex transcript architecture of MET7. (d) Overlapping transcripts of two ORFs. (e) Adjacent transcripts of SER3 and the noncoding SRG1. (f) Nonannotated isolated transcript. (g) Transcript antisense to SPO22. CDS refers to coding sequence; uORF, upstream ORF; ncRNA, noncoding RNA; TF, transcription factor. Plot layout as in Fig. 1.
Fig. 3.
Fig. 3.
Length of UTRs and functional categories with exceptional UTR length. Analyses were based on 2,044 genes from poly(A) samples. (a) Scatterplot and histogram of 3′ vs. 5′ UTR lengths. (b) Association between UTR length, cellular localization, and biological process. Length distributions between genes inside and outside of GO categories were compared, and selected significant categories are shown (orange, cellular component; green, biological process; blue, molecular function). For each category, a horizontal line shows the 5′ and 3′ median UTR lengths measured in nucleotides (x axis). The median over all genes is shown by a vertical dashed line. Significant medians are indicated by asterisks, red longer, blue shorter (two-sided Wilcoxon test, P ≤ 0.002).
Fig. 4.
Fig. 4.
Categories of expressed segments, their length, and their expression levels. (a) Number and percentage of the expressed segments detected from the poly(A) RNA and total RNA hybridizations. Categories “>= 50%” and “<50%” consist of segments that overlap more, or less, than half of an annotated feature, respectively. The “nonannotated isolated” category consists of segments that have no overlap with annotated features on either strand, whereas the “nonannotated antisense” category consists of those that overlap with features on the opposite strand. The “filtered” categories consist of the high confidence segments that passed our filter, and the “unassigned” categories consist of the remaining segments. Length (b) and transcript level (c) distributions for segments from the above categories are given.

References

    1. Wilkie G. S., Dickson K. S., Gray N. K. Trends Biochem. Sci. 2003;28:182–188. - PubMed
    1. Storz G., Altuvia S., Wassarman K. M. Annu. Rev. Biochem. 2005;74:199–217. - PubMed
    1. Katayama S., Tomaru Y., Kasukawa T., Waki K., Nakanishi M., Nakamura M., Nishida H., Yap C. C., Suzuki M., Kawai J., et al. Science. 2005;309:1564–1566. - PubMed
    1. Mattick J. S. Nat. Rev. Genet. 2004;5:316–323. - PubMed
    1. Cheng J., Kapranov P., Drenkow J., Dike S., Brubaker S., Patel S., Long J., Stern D., Tammana H., Helt G., et al. Science. 2005;308:1149–1154. - PubMed

Publication types