

A physical model of axonal damage due to oxidative stress
- PMID: 16569704
- PMCID: PMC1459344
- DOI: 10.1073/pnas.0504134103
A physical model of axonal damage due to oxidative stress
Abstract
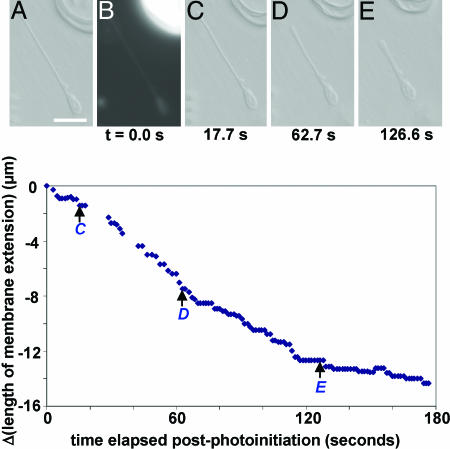
Oxidative damage is implicated in the pathogenesis of neurodegenerative disorders, including Alzheimer's, Parkinson's, and Huntington's diseases, and in normal aging. Here, we model oxidative stress in neurons using photogenerated radicals in a simplified membrane-encapsulated microtubule system. Using fluorescence and differential interference contrast microscopies, we monitor photochemically induced microtubule breakdown on the supported region of membrane in encapsulating synthetic liposomes as a function of lipid composition and environment. Degradation of vesicle-encapsulated microtubules is caused by attack from free radicals formed upon UV excitation of the lipid-soluble fluorescent probe, 6-(9-anthroyloxy)stearic acid. Probe concentration was typically limited to a regime in which microtubule degradation was slow, and microtubule degradation was monitored by changes in the observed protrusion of the membrane surface. The kinetics of microtubule degradation are influenced by lipid saturation level, fluorescent probe concentration, and the presence of free-radical scavengers. This system is sufficient to reproduce some degenerative morphologies found in vivo.
Conflict of interest statement
Conflict of interest statement: No conflicts declared.
Figures


Similar articles
-
Free radical damage and oxidative stress in Huntington's disease.J Fla Med Assoc. 1996 May;83(5):335-41. J Fla Med Assoc. 1996. PMID: 8666972 Review.
-
Environmental-induced oxidative stress in neurodegenerative disorders and aging.Mutat Res. 2009 Mar 31;674(1-2):73-84. doi: 10.1016/j.mrgentox.2008.09.013. Epub 2008 Oct 5. Mutat Res. 2009. PMID: 18952194 Review.
-
Monitoring by cis-parinaric fluorescence of free radical induced lipid peroxidation in aqueous liposome suspensions.J Microencapsul. 1996 Jul-Aug;13(4):435-45. doi: 10.3109/02652049609026029. J Microencapsul. 1996. PMID: 8808780
-
Oxidative stress, mitochondrial dysfunction and cellular stress response in Friedreich's ataxia.J Neurol Sci. 2005 Jun 15;233(1-2):145-62. doi: 10.1016/j.jns.2005.03.012. J Neurol Sci. 2005. PMID: 15896810 Review.
-
Oxidative stress in Parkinson's disease and other neurodegenerative disorders.Pathol Biol (Paris). 1996 Jan;44(1):57-64. Pathol Biol (Paris). 1996. PMID: 8734302 Review.
Cited by
-
Liraglutide activates autophagy via GLP-1R to improve functional recovery after spinal cord injury.Oncotarget. 2017 Sep 8;8(49):85949-85968. doi: 10.18632/oncotarget.20791. eCollection 2017 Oct 17. Oncotarget. 2017. PMID: 29156769 Free PMC article.
-
Cerebrospinal fluid dehydroepiandrosterone levels are correlated with brain dehydroepiandrosterone levels, elevated in Alzheimer's disease, and related to neuropathological disease stage.J Clin Endocrinol Metab. 2008 Aug;93(8):3173-8. doi: 10.1210/jc.2007-1229. Epub 2008 May 13. J Clin Endocrinol Metab. 2008. PMID: 18477662 Free PMC article.
-
Oxidative stress and proinflammatory cytokines contribute to demyelination and axonal damage in a cerebellar culture model of neuroinflammation.PLoS One. 2013;8(2):e54722. doi: 10.1371/journal.pone.0054722. Epub 2013 Feb 19. PLoS One. 2013. PMID: 23431360 Free PMC article.
References
-
- Strong R., Mattamal M. B., Andorn A. C. In: Free Radicals in Aging. Yu B. P., editor. Ann Arbor, MI: CRC; 1993. pp. 223–246.
-
- Knight J. A. Free Radicals, Antioxidants, Aging, and Disease. Washington, DC: Am. Assoc. for Clin. Chem.; 1999.
-
- Aksenov M. Y., Aksenova M. V., Butterfield D. A., Geddes J. W., Markesbery W. R. Neuroscience. 2001;103:373–383. - PubMed
-
- Beal M. F. Free Radical Biol. Med. 2002;32:797–803. - PubMed
-
- Montine T. J., Neely M. D., Quinn J. F., Beal M. F., Markesbery W. R., Roberts L. J., II, Morrow J. D. Free Radical Biol. Med. 2002;33:620–626. - PubMed
Publication types
MeSH terms
Substances
LinkOut - more resources
Full Text Sources
