

Time course of microbiologic outcome and gene expression in Candida albicans during and following in vitro and in vivo exposure to fluconazole
- PMID: 16569846
- PMCID: PMC1426956
- DOI: 10.1128/AAC.50.4.1311-1319.2006
Time course of microbiologic outcome and gene expression in Candida albicans during and following in vitro and in vivo exposure to fluconazole
Abstract
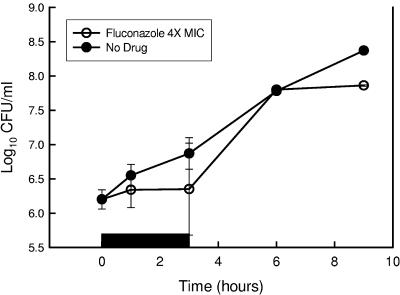
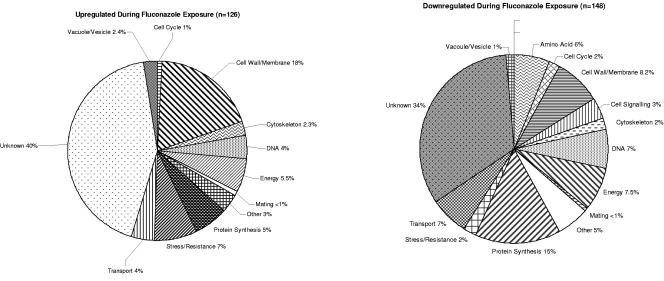
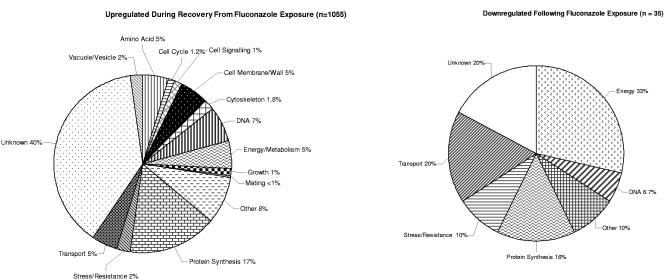
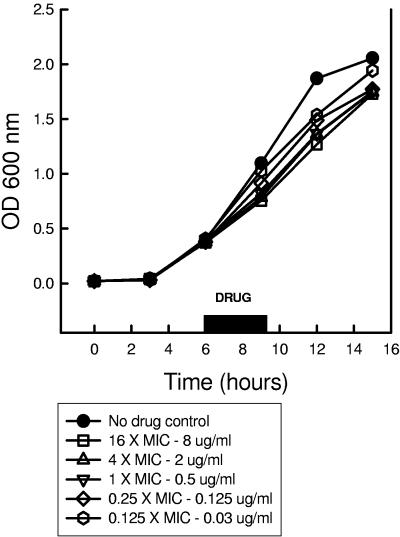
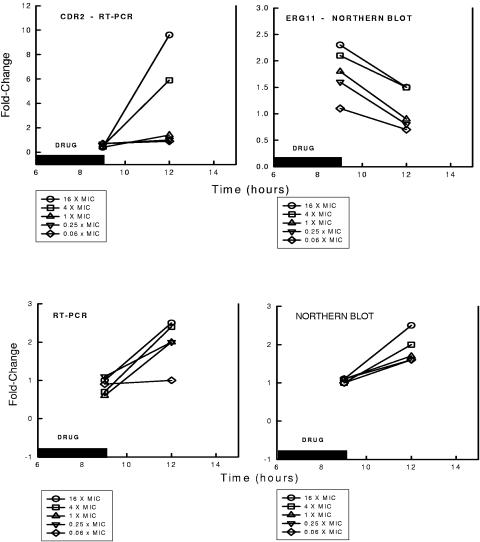
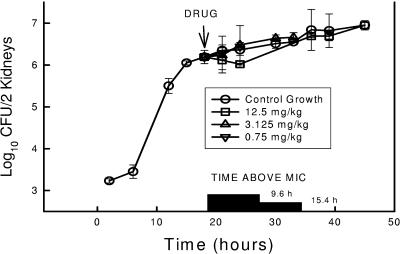
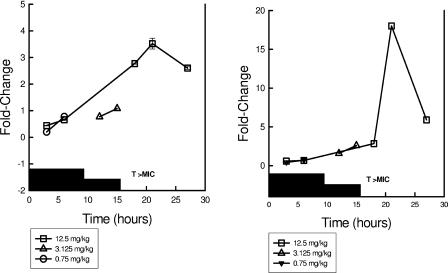
Pharmacodynamics (PD) considers the relationship between drug exposure and effect. The two factors that have been used to distinguish the PD behaviors of antimicrobials are the impact of concentration on the extent of organism killing and the duration of persistent microbiologic suppression (postantibiotic effect). The goals of these studies were (i) to examine the relationship between antimicrobial PD and gene expression and (ii) to gain insight into the mechanism of fluconazole effects persisting following exposure. Microarrays were used to estimate the transcriptional response of Candida albicans to a supra-MIC F exposure over time in vitro. Fluconazole at four times the MIC was added to a log-phase C. albicans culture, and cells were collected to determine viable growth and for microarray analyses. We identified differential expression of 18% of all genes for at least one of the time points. More genes were upregulated (n=1,053 [16%]) than downregulated (174 [3%]). Of genes with known function that were upregulated during exposure, most were related to plasma membrane/cell wall synthesis (18%), stress responses (7%), and metabolism (6%). The categories of downregulated genes during exposure included protein synthesis (15%), DNA synthesis/repair (7%), and transport (7%) genes. The majority of genes identified at the postexposure time points were from the protein (17%) and DNA (7%) synthesis categories. In subsequent studies, three genes (CDR1, CDR2, and ERG11) were examined in greater detail (more concentration and time points) following fluconazole exposure in vitro and in vivo. Expression levels from the in vitro and in vivo studies were congruent. CDR1 and CDR2 transcripts were reduced during in vitro fluconazole exposure and during supra-MIC exposure in vivo. However, in the postexposure period, the mRNA abundance of both pumps increased. ERG11 expression increased during exposure and fell in the postexposure period. The expression of the three genes responded in a dose-dependent manner. In sum, the microarray data obtained during and following fluconazole exposure identified genes both known and unknown to be affected by this drug class. The expanded in vitro and in vivo expression data set underscores the importance of considering the time course of exposure in pharmacogenomic investigations.
Figures
Similar articles
-
Antifungal effect of Echinophora platyloba on expression of CDR1 and CDR2 genes in fluconazole-resistant Candida albicans.Br J Biomed Sci. 2016;73(1):44-8. doi: 10.1080/09674845.2016.1155269. Br J Biomed Sci. 2016. PMID: 27182677
-
Expression of Major Efflux Pumps in Fluconazole-Resistant Candida albicans.Infect Disord Drug Targets. 2017;17(3):178-184. doi: 10.2174/1871526517666170531114335. Infect Disord Drug Targets. 2017. PMID: 28558643
-
[Investigation of the expression levels of efflux pumps in fluconazole-resistant Candida albicans isolates].Mikrobiyol Bul. 2014 Apr;48(2):325-34. doi: 10.5578/mb.7213. Mikrobiyol Bul. 2014. PMID: 24819270 Turkish.
-
Molecular mechanisms associated with Fluconazole resistance in clinical Candida albicans isolates from India.Mycoses. 2016 Feb;59(2):93-100. doi: 10.1111/myc.12439. Epub 2015 Dec 9. Mycoses. 2016. PMID: 26648048
-
[Investigation of mutations in transcription factors of efflux pump genes in fluconazole-resistant Candida albicans strains overexpressing the efflux pumps].Mikrobiyol Bul. 2015 Oct;49(4):609-18. doi: 10.5578/mb.10105. Mikrobiyol Bul. 2015. PMID: 26649419 Turkish.
Cited by
-
Ibuprofen potentiates the in vivo antifungal activity of fluconazole against Candida albicans murine infection.Antimicrob Agents Chemother. 2015 Jul;59(7):4289-92. doi: 10.1128/AAC.05056-14. Epub 2015 Apr 6. Antimicrob Agents Chemother. 2015. PMID: 25845879 Free PMC article.
-
Molecular Mechanisms Associated with Antifungal Resistance in Pathogenic Candida Species.Cells. 2023 Nov 19;12(22):2655. doi: 10.3390/cells12222655. Cells. 2023. PMID: 37998390 Free PMC article. Review.
-
Potent synergistic effect of doxycycline with fluconazole against Candida albicans is mediated by interference with iron homeostasis.Antimicrob Agents Chemother. 2012 Jul;56(7):3785-96. doi: 10.1128/AAC.06017-11. Epub 2012 May 7. Antimicrob Agents Chemother. 2012. PMID: 22564841 Free PMC article.
-
Time course global gene expression analysis of an in vivo Candida biofilm.J Infect Dis. 2009 Jul 15;200(2):307-13. doi: 10.1086/599838. J Infect Dis. 2009. PMID: 19527170 Free PMC article.
-
Evolutionary divergence in the fungal response to fluconazole revealed by soft clustering.Genome Biol. 2010;11(7):R77. doi: 10.1186/gb-2010-11-7-r77. Epub 2010 Jul 23. Genome Biol. 2010. PMID: 20653936 Free PMC article.
References
-
- Agarwal, A. K., P. D. Rogers, S. R. Baerson, M. R. Jacob, K. S. Barker, J. D. Cleary, L. A. Walker, D. G. Nagle, and A. M. Clark. 2003. Genome-wide expression profiling of the response to polyene, pyrimidine, azole, and echinocandin antifungal agents in Saccharomyces cerevisiae. J. Biol. Chem. 278:34998-35015. - PubMed
-
- Andes, D., A Lepak, A. Pitula, K. Marchillo, and J. Clark. 2005. A simple approach for estimating gene expression in Candida albicans directly from a systemic infection site. J. Infect. Dis. 192:893-900. - PubMed
MeSH terms
Substances
Grants and funding
LinkOut - more resources
Full Text Sources
Other Literature Sources
