. 2006 Apr;50(4):1376-83.
doi: 10.1128/AAC.50.4.1376-1383.2006.

Pharmacodynamics of a new cephalosporin, PPI-0903 (TAK-599), active against methicillin-resistant Staphylococcus aureus in murine thigh and lung infection models: identification of an in vivo pharmacokinetic-pharmacodynamic target

Affiliations

Pharmacodynamics of a new cephalosporin, PPI-0903 (TAK-599), active against methicillin-resistant Staphylococcus aureus in murine thigh and lung infection models: identification of an in vivo pharmacokinetic-pharmacodynamic target

D Andes et al. Antimicrob Agents Chemother. 2006 Apr.

Erratum in

  • Antimicrob Agents Chemother. 2014 Apr;58(4):2489. Dosage error in article text

Abstract

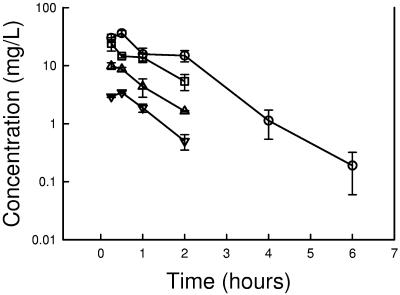
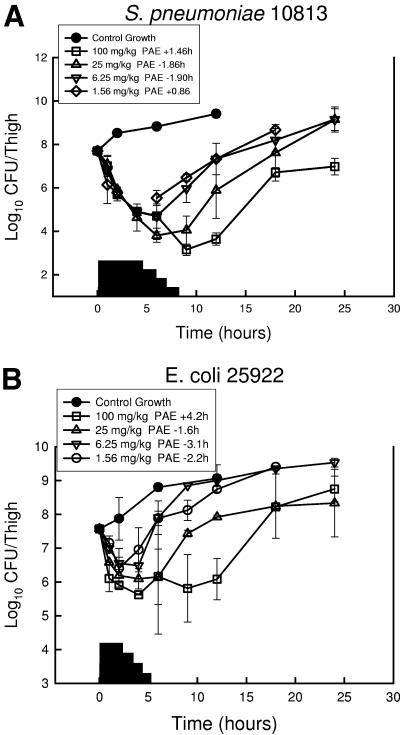
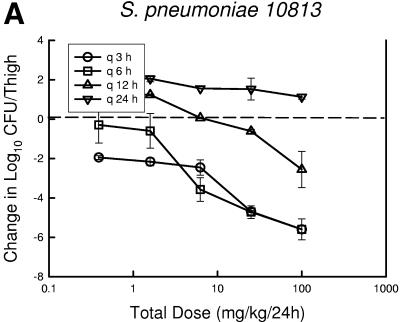
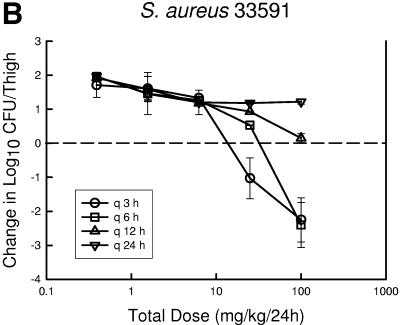
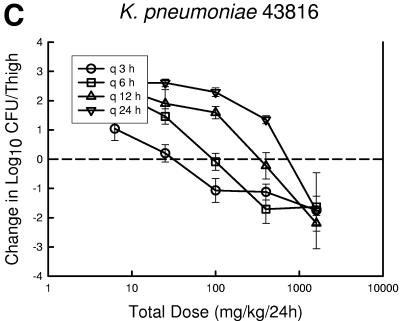
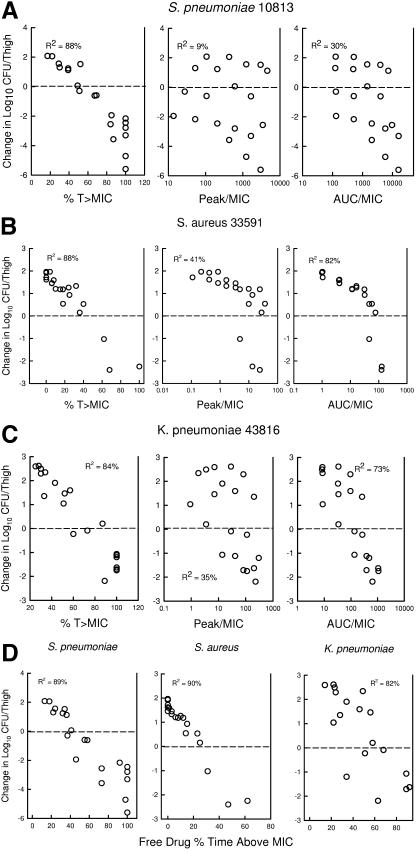
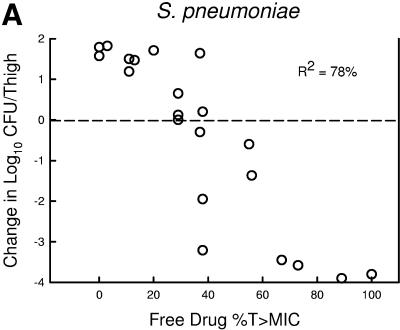
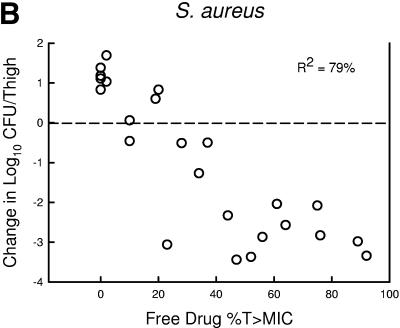
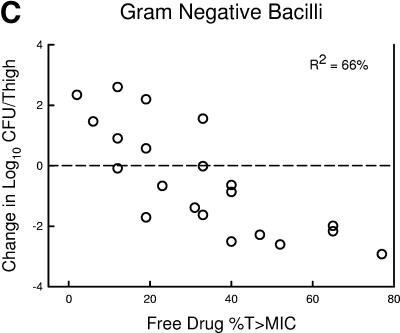
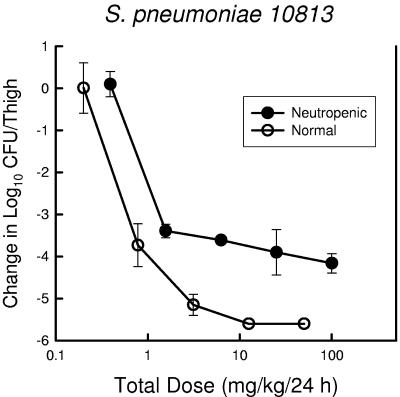
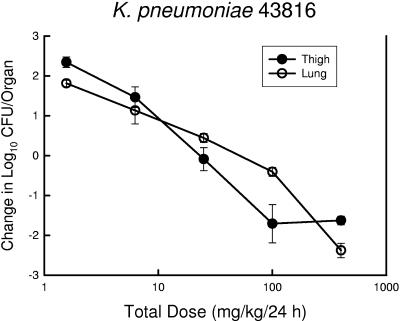
PPI-0903 is a new cephalosporin with broad-spectrum activity, including beta-lactam-resistant Streptococcus pneumoniae and Staphylococcus aureus. We used the neutropenic murine thigh and lung infection models to examine the pharmacodynamic characteristics of PPI-0903. Serum drug levels following four fourfold-escalating single doses of PPI-0903 were measured by microbiologic assay. In vivo postantibiotic effects (PAEs) were determined after doses of 1.56, 6.25, 25, and 100 mg/kg of body weight in mice infected with S. pneumoniae ATCC 10813, S. aureus ATCC 29213, or Escherichia coli ATCC 25922. Dose fractionation studies over a 24-h dose range of 0.39 to 1,600 mg/kg were administered every 3, 6, 12, or 24 hours. Nonlinear regression analysis was used to determine which pharmacokinetic-pharmacodynamic (PK-PD) index (total and free 65% drug) best correlated with CFU/thigh at 24 h. Similar to other beta-lactam antibiotics, PPI-0903 produced short to modest in vivo PAEs with either S. pneumoniae or E. coli. The percent time that serum concentrations were above the MIC (%T>MIC) was the PK-PD index that best correlated with efficacy (R2=84 to 88% for the three organisms, compared with 9 to 41% for peak/MIC and 30 to 82% for the area under the concentration-time curve/MIC). In subsequent studies we used the neutropenic murine thigh infection model to determine if the magnitude of the free-drug % T>MIC needed for efficacy of PPI-0903 varied among pathogens (including resistant strains). Mice infected with one of five isolates of S. pneumoniae, four isolates of S. aureus, or four gram-negative bacilli were treated for 24 h with 0.10 to 400 mg/kg of PPI-0903 every 6 h. A sigmoid dose-response model was used to estimate the doses (mg/kg/24 h) required to achieve a net bacteriostatic affect over 24 h and to produce a reduction in the burden of organisms from the start of therapy by 1 and 2 log10 CFU/thigh. MICs ranged from 0.008 to 1 microg/ml.Mean free-drug %T >MICs the standard deviation associated with the static effect endpoint for S. pneumoniae, S. aureus, and gram-negative isolates were 39±9, 26±8, and 47±8, respectively [corrected]. Methicillin and penicillin resistance did not alter the magnitude of free-drug %T>MIC required for efficacy. The free-drug %T>MIC necessary for efficacy was slightly reduced in animals with normal neutrophil counts. Treatment effect was similar in both the thigh and lung infection models. The pharmacodynamic characteristics of PPI-0903 are similar to those of other compounds within the cephalosporin class.


Figures

FIG. 1.
FIG. 1.
Serum PPI-0903 concentrations (total drug) after administration of single doses of 1.56, 6.25, 25, and 100 mg/kg in neutropenic infected mice. Each symbol represents the mean ± standard deviation of the levels in the sera of three mice.
FIG. 2.
FIG. 2.
In vivo PAE of PPI-0903 after administration of single doses of 1.56, 6.25, 25, and 100 mg/kg against S. pneumoniae ATCC 10813 (a), S. aureus ATCC 29213 (b), and E. coli ATCC 25922 (c). Each symbol represents the mean ± standard deviation for two mice. Widths of the solid bars represent the duration of time free-drug serum levels exceeded the MIC of the infecting pathogen.
FIG.3.
FIG.3.
Relationship between PPI-0903 dosing interval and efficacy against S. pneumoniae ATCC 10813 (a), S. aureus ATCC 33591 (b), and K. pneumoniae ATCC 43816 (c) in a murine thigh infection model. Each symbol represents the mean data from two mice (four thighs). The dashed horizontal line represents the burden of organisms at the start of therapy. Data below the line represent killing, and data above the line show growth.
FIG.3.
FIG.3.
Relationship between PPI-0903 dosing interval and efficacy against S. pneumoniae ATCC 10813 (a), S. aureus ATCC 33591 (b), and K. pneumoniae ATCC 43816 (c) in a murine thigh infection model. Each symbol represents the mean data from two mice (four thighs). The dashed horizontal line represents the burden of organisms at the start of therapy. Data below the line represent killing, and data above the line show growth.
FIG. 4.
FIG. 4.
Relationships of the PPI-0903 total drug level, %T>MIC, peak/MIC, and 24-h AUC/MIC for S. pneumoniae ATCC 10813 (a), S. aureus 33591 (b), and K. pneumoniae (c) with the change in log10 CFU/thigh after 24 h of therapy. Each symbol represents the mean data from two mice (four thighs). The dashed horizontal line represents the burden of organisms at the start of therapy. Data above the line represent growth, and data below the line represent killing. R2 is the coefficient of determination.
FIG.5.
FIG.5.
Relationship between the PPI-0903 free-drug %T>MIC and efficacy against five S. pneumoniae (a), four S. aureus (b), and four gram-negative bacilli (c). Each symbol represents the mean data for two mice (four thighs). R2 is the coefficient of determination. The dashed horizontal line represents the burden of organisms at the start of therapy. Data below the line represent killing, and data above the line represent growth.
FIG.5.
FIG.5.
Relationship between the PPI-0903 free-drug %T>MIC and efficacy against five S. pneumoniae (a), four S. aureus (b), and four gram-negative bacilli (c). Each symbol represents the mean data for two mice (four thighs). R2 is the coefficient of determination. The dashed horizontal line represents the burden of organisms at the start of therapy. Data below the line represent killing, and data above the line represent growth.
FIG. 6.
FIG. 6.
Relationship between PPI-093 dose level and change in log10 CFU/thigh in both normal (hollow symbols) and neutropenic (solid symbols) mice infected with S. pneumoniae ATCC 10813. Each symbol represents the mean data for two mice (four thighs).
FIG. 7.
FIG. 7.
Relationship between PPI-093 dose level and change in log10 CFU/organ in mice infected with K. pneumoniae ATCC 43816 in both the thigh (solid symbols) and lung (hollow symbols) infection models. Each symbol represents the mean data for two mice (four thighs).

References

    1. Ambrose, P. G., R. Quintiliani, and N. Chin. 1997. Continuous vs intermittent infusion of cefuroxime for the treatment of community-acquired pneumonia. Infect. Dis. Clin. Pract. 7:463-470.
    1. Andes, D., and W. A. Craig. 2002. A critical review of animal model pharmacokinetics and pharmacodynamics. Int. J. Antimicrob. Agents 19:261-268. - PubMed
    1. Andes, D., and W. A. Craig. 1998. In vivo activities of amoxicillin and amoxicillin-clavulanate against Streptococcus pneumoniae: application to breakpoint determinations. Antimicrob. Agents Chemother. 42:2375-2379. - PMC - PubMed
    1. Craig, W. A. 1998. Pharmacokinetics and pharmacodynamics of antibiotics in mice and men. Clin. Infect. Dis. 26:1-12. - PubMed
    1. Craig, W. A. 1995. Interrelationship between pharmacokinetics and pharmacodynamics in determining dosage regimens for broad-spectrum cephalosporins. Diagn. Microbiol. Infect. Dis. 22:89-96. - PubMed

Substances

LinkOut - more resources