

Uneven distribution of nucleoside transporters and intracellular enzymatic degradation prevent transport of intact [14C] adenosine across the sheep choroid plexus epithelium as a monolayer in primary culture
- PMID: 16571111
- PMCID: PMC1450313
- DOI: 10.1186/1743-8454-3-4
Uneven distribution of nucleoside transporters and intracellular enzymatic degradation prevent transport of intact [14C] adenosine across the sheep choroid plexus epithelium as a monolayer in primary culture
Abstract
Background: Efflux transport of adenosine across the choroid plexus (CP) epithelium might contribute to the homeostasis of this neuromodulator in the extracellular fluids of the brain. The aim of this study was to explore adenosine transport across sheep CP epithelial cell monolayers in primary culture.
Methods: To explore transport of adenosine across the CP epithelium, we have developed a method for primary culture of the sheep choroid plexus epithelial cells (CPEC) on plastic permeable supports and analysed [14C] adenosine transport across this cellular layer, [14C] adenosine metabolism inside the cells, and cellular uptake of [14C] adenosine from either of the chambers. The primary cell culture consisted of an enriched epithelial cell fraction from the sheep fourth ventricle CP and was grown on laminin-precoated filter inserts.
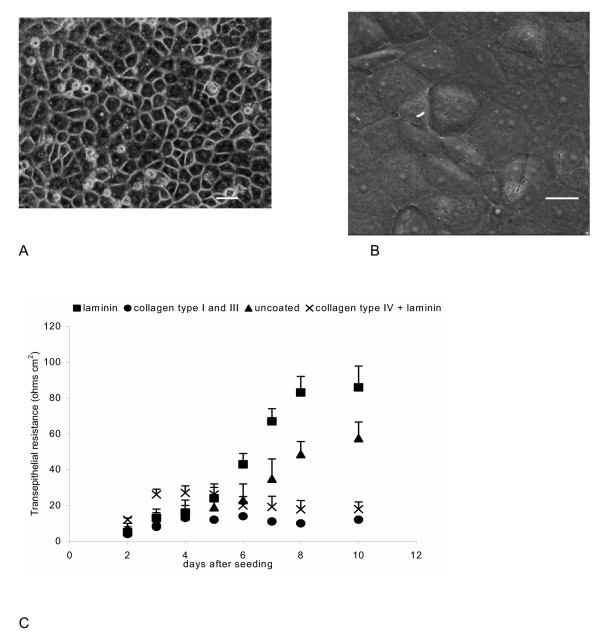
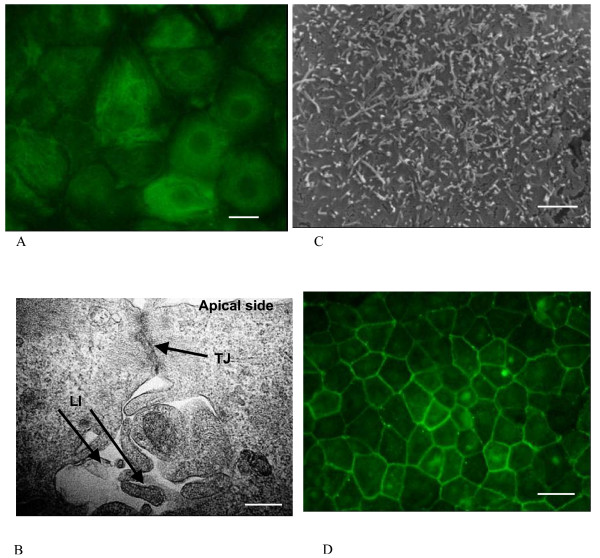
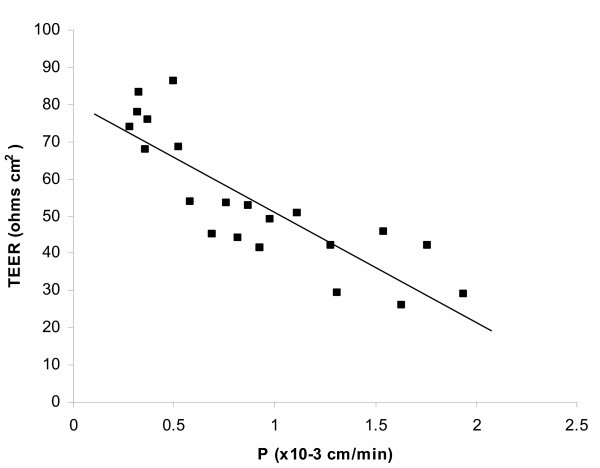
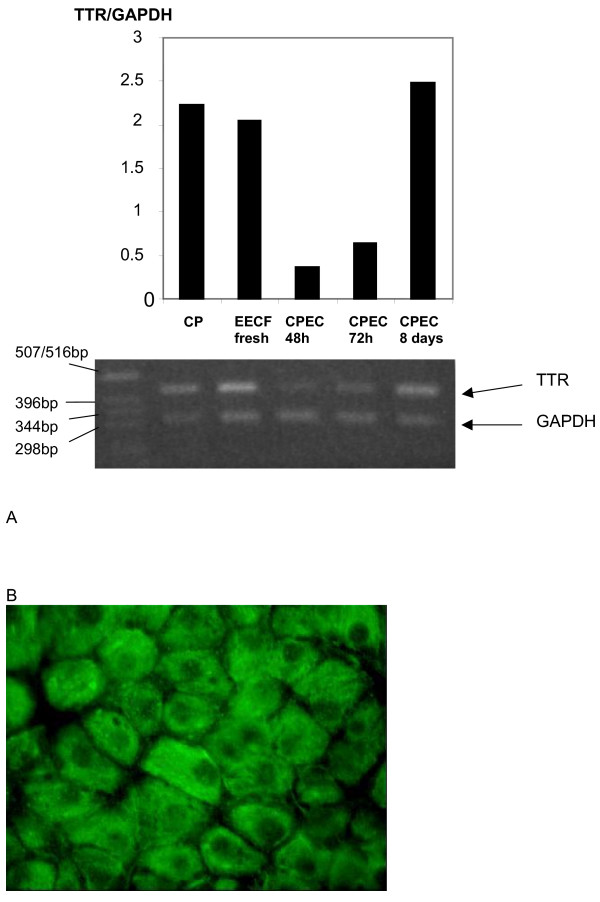
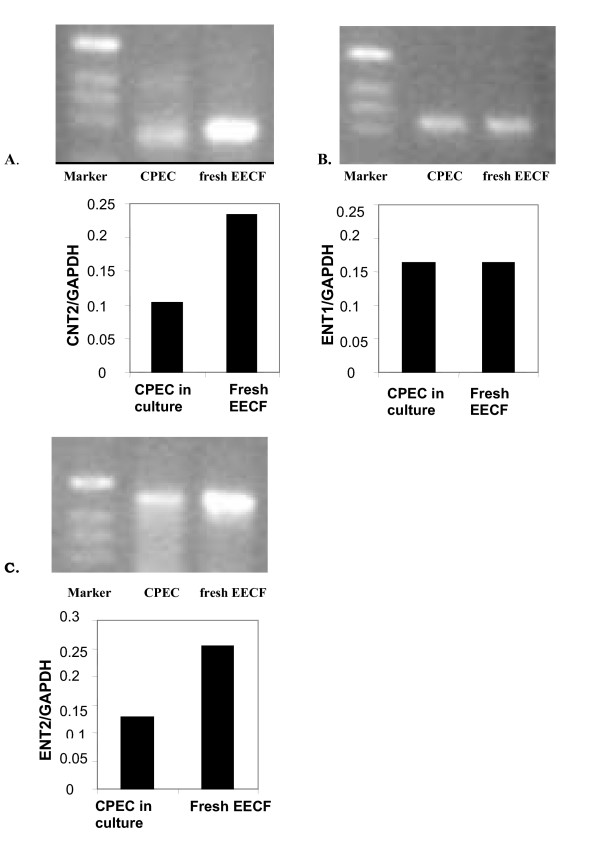
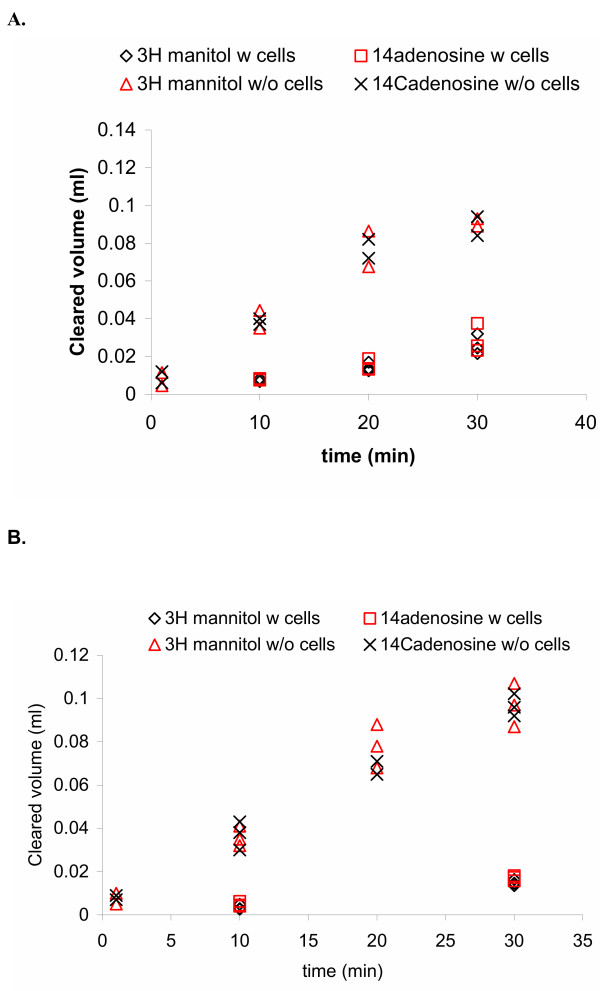
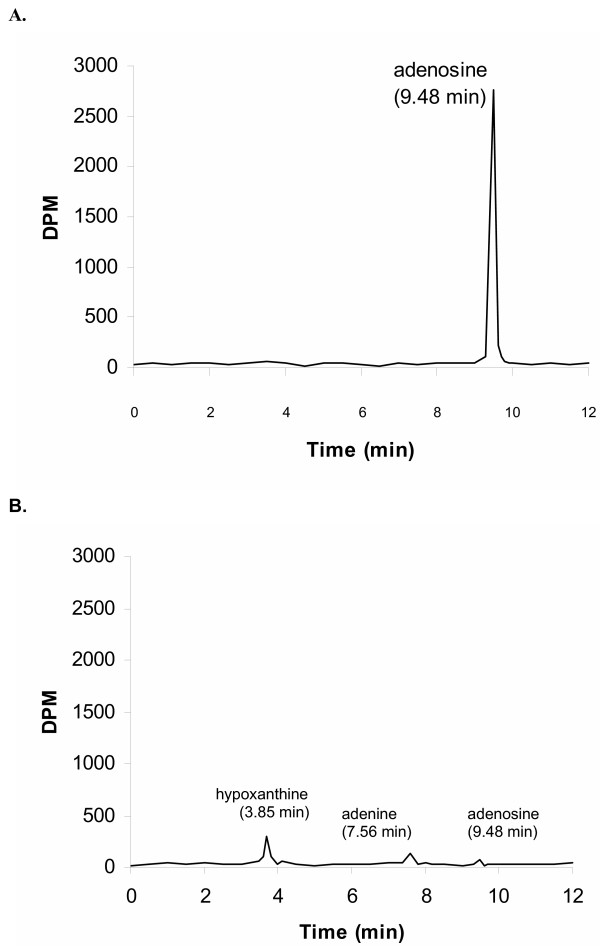
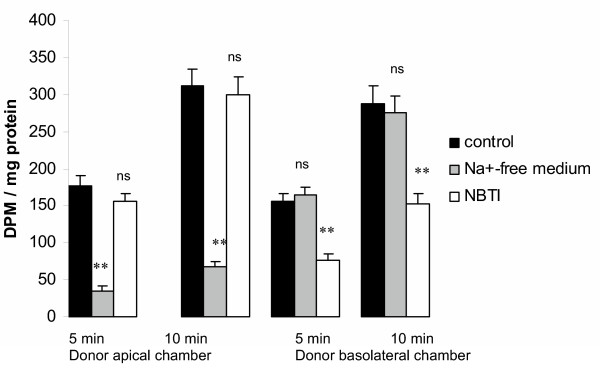
Results and conclusion: CPEC grew as monolayers forming typical polygonal islands, reaching optical confluence on the third day after the seeding. Transepithelial electrical resistance increased over the time after seeding up to 85 +/- 9 Omega cm2 at day 8, while permeability towards [14C] sucrose, a marker of paracellular diffusion, simultaneously decreased. These cells expressed some features typical of the CPEC in situ, including three nucleoside transporters at the transcript level that normally mediate adenosine transport across cellular membranes. The estimated permeability of these monolayers towards [14C] adenosine was low and the same order of magnitude as for the markers of paracellular diffusion.However, inhibition of the intracellular enzymes, adenosine kinase and adenosine deaminase, led to a significant increase in transcellular permeability, indicating that intracellular phosphorylation into nucleotides might be a reason for the low transcellular permeability. HPLC analysis with simultaneous detection of radioactivity revealed that [14C] radioactivity which appeared in the acceptor chamber after the incubation of CPEC monolayers with [14C] adenosine in the donor chamber was mostly present as [14C] hypoxanthine, a product of adenosine metabolic degradation. Therefore, it appears that CPEC in primary cultures act as an enzymatic barrier towards adenosine. Cellular uptake studies revealed that concentrative uptake of [14C] adenosine was confined only to the side of these cells facing the upper or apical chamber, indicating uneven distribution of nucleoside transporters.
Figures
Similar articles
-
Transport of [14C]hypoxanthine by sheep choroid plexus epithelium as a monolayer in primary culture: Na+-dependent and Na+-independent uptake by the apical membrane and rapid intracellular metabolic conversion to nucleotides.Neurosci Lett. 2008 Jan 31;431(2):135-40. doi: 10.1016/j.neulet.2007.11.029. Epub 2007 Dec 3. Neurosci Lett. 2008. PMID: 18164814
-
Kinetics of nucleoside uptake by the basolateral side of the sheep choroid plexus epithelium perfused in situ.Exp Physiol. 2008 Mar;93(3):325-33. doi: 10.1113/expphysiol.2007.040980. Epub 2007 Nov 26. Exp Physiol. 2008. PMID: 18039975
-
Polarized distribution of nucleoside transporters in rat brain endothelial and choroid plexus epithelial cells.J Neurochem. 2005 Sep;94(5):1420-6. doi: 10.1111/j.1471-4159.2005.03312.x. J Neurochem. 2005. PMID: 16111480
-
Brain iron homeostasis.Dan Med Bull. 2002 Nov;49(4):279-301. Dan Med Bull. 2002. PMID: 12553165 Review.
-
Usefulness and limitation of primary cultured porcine choroid plexus epithelial cells as an in vitro model to study drug transport at the blood-CSF barrier.Adv Drug Deliv Rev. 2004 Oct 14;56(12):1859-73. doi: 10.1016/j.addr.2004.07.012. Adv Drug Deliv Rev. 2004. PMID: 15381337 Review.
Cited by
-
Choroid plexus epithelial monolayers--a cell culture model from porcine brain.Cerebrospinal Fluid Res. 2006 Dec 21;3:13. doi: 10.1186/1743-8454-3-13. Cerebrospinal Fluid Res. 2006. PMID: 17184532 Free PMC article.
-
Molecular biology of the blood-brain and the blood-cerebrospinal fluid barriers: similarities and differences.Fluids Barriers CNS. 2011 Jan 18;8(1):3. doi: 10.1186/2045-8118-8-3. Fluids Barriers CNS. 2011. PMID: 21349151 Free PMC article.
-
The legacy of Malcolm Beverley Segal (1937-2019) on the science and fields concerned with choroid plexus and cerebrospinal fluid physiology.Fluids Barriers CNS. 2019 Dec 19;16(1):41. doi: 10.1186/s12987-019-0161-6. Fluids Barriers CNS. 2019. PMID: 31856859 Free PMC article.
-
Studies on the human choroid plexus in vitro.Fluids Barriers CNS. 2013 Feb 7;10(1):10. doi: 10.1186/2045-8118-10-10. Fluids Barriers CNS. 2013. PMID: 23391221 Free PMC article.
-
Basal Sodium-Dependent Vitamin C Transporter 2 polarization in choroid plexus explant cells in normal or scorbutic conditions.Sci Rep. 2019 Oct 8;9(1):14422. doi: 10.1038/s41598-019-50772-2. Sci Rep. 2019. PMID: 31594969 Free PMC article.
References
-
- Melani A, Pantoni L, Corsi C, Bianchi L, Monopoli A, Bertorelli R, Pepeu G, Pedata F. Striatal outflow of adenosine, excitatory amino acids, c-aminobutyric acid and taurine in awake freely moving rats after middle cerebral artery occlusion. Correlation with neurological deficit and histopathological damage. Stroke. 1999;30:2448–2455. - PubMed
Grants and funding
LinkOut - more resources
Full Text Sources
Research Materials
Miscellaneous
