. 2006 Mar 29:7:64.
doi: 10.1186/1471-2164-7-64.

"Per cell" normalization method for mRNA measurement by quantitative PCR and microarrays

Affiliations

"Per cell" normalization method for mRNA measurement by quantitative PCR and microarrays

Jun Kanno et al. BMC Genomics. .

Abstract

Background: Transcriptome data from quantitative PCR (Q-PCR) and DNA microarrays are typically obtained from a fixed amount of RNA collected per sample. Therefore, variations in tissue cellularity and RNA yield across samples in an experimental series compromise accurate determination of the absolute level of each mRNA species per cell in any sample. Since mRNAs are copied from genomic DNA, the simplest way to express mRNA level would be as copy number per template DNA, or more practically, as copy number per cell.

Results: Here we report a method (designated the "Percellome" method) for normalizing the expression of mRNA values in biological samples. It provides a "per cell" readout in mRNA copy number and is applicable to both quantitative PCR (Q-PCR) and DNA microarray studies. The genomic DNA content of each sample homogenate was measured from a small aliquot to derive the number of cells in the sample. A cocktail of five external spike RNAs admixed in a dose-graded manner (dose-graded spike cocktail; GSC) was prepared and added to each homogenate in proportion to its DNA content. In this way, the spike mRNAs represented absolute copy numbers per cell in the sample. The signals from the five spike mRNAs were used as a dose-response standard curve for each sample, enabling us to convert all the signals measured to copy numbers per cell in an expression profile-independent manner. A series of samples was measured by Q-PCR and Affymetrix GeneChip microarrays using this Percellome method, and the results showed up to 90 % concordance.

Conclusion: Percellome data can be compared directly among samples and among different studies, and between different platforms, without further normalization. Therefore, "percellome" normalization can serve as a standard method for exchanging and comparing data across different platforms and among different laboratories.


Figures

Figure 1
Figure 1
Dose-response linearity check by LBM. Dose-response linearity of the Affymetrix GeneChip by the LBM (liver-brain mix) sample set. Five samples, i.e. mixtures of mouse liver and brain at ratios of 100:0, 75:25, 50:50, 25:75 and 0:100, were spiked with GSC and measured by Affymetrix GeneChips Mouse430-2. Signals were normalized by the Percellome method as described in the text. Line graphs are in (a) copy numbers and (b) ratio to 50:50 sample for the top 1,000 probe sets with coefficient of correlation (R2) closest to 1 among those having 1 copy or more per cell in the 50:50 sample (19,979 probe sets out of 45,101). The number of probe sets with R2 > 0.950 was 8,655, and R2 > 0.900 was 11,719.
Figure 2
Figure 2
Cross-hybridization of GSC. Cross-hybridization of the GSC spike mRNAs to Affymetrix GeneChip. (a) A scatter plot of a blank sample with the GSC (horizontal axis) and a blank with the five spike RNAs at a high dosage (vertical axis) measured by MG-U74v2A GeneChips (raw values generated by Affymetrix MAS 5.0 software). The five spikes are indicated by black dots with arrows. Signals of the murine probe sets were below 20 on the horizontal axis, indicating negligible cross-hybridization of GSC spike mRNAs to the murine probe sets. (b) A scatter plot of a liver sample with GSC (horizontal axis) and without GSC (vertical axis) measured by MG-U74v2A GeneChips. The five spikes are again indicated by black dots with arrows. The dotted line is the 1/25 fold (4%) line. Cross-hybridization of mouse liver mRNAs to the GSC signals was considered negligible (less than 4%).
Figure 3
Figure 3
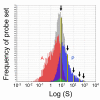
Positioning of GSC spike mRNAs in Affymetrix GeneChip dose-response range. A frequency histogram of the probe sets of Affymetrix GeneChip Mouse430-2 is shown. The histogram for all probe sets (gray) shows near-normal distribution. Blue columns are the "present" calls (P), red columns "absent" calls (A) and green "marginal" calls. The five yellow lines indicate the positions of the GSC spike mRNAs that are chosen to cover the "present" call range by a proper "spike factor".
Figure 4
Figure 4
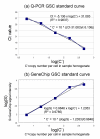
The dose-response linearity of the GSC spikes in Q-PCR and the Affymetrix GeneChip array system. Linear relationships are shown between (a) the Q-PCR Ct values and log of copy number (log (C')), and (b) the GeneChip log signal intensity (log(S)) and log of copy number (log (C')) of the GSC mRNAs. The regression functions were obtained by the least squares method. The inverse functions (*) were further used to generate the copy numbers of all other genes/probe sets for Percellome normalization.
Figure 5
Figure 5
Correspondence between Q-PCR and GeneChip data. Sixty male C57BL/6 mice were divided into 20 groups of 3 mice each. 2,3,7,8-tetrachlorodibenzodioxin (TCDD) was administered once orally at doses of 0, 1, 3, 10 and 30μg/kg, and the liver was sampled 2, 4, 8 and 24 h after administration. The liver transcriptome was measured by the Affymetrix Mouse430-2 GeneChip. For Q-PCR, nineteen primary pairs were prepared and the Ct values of the same 60 liver samples were measured (19 genes and 5 spikes in duplicate, using a 96-well plate for 2 samples, total 30 plates). The Percellome data were plotted on to 3-dimensional graphs for average, +1sd, and – 1sd surfaces as shown in (a). The scale of expression (vertical axis) is the copy number per cell. The 0 h data (*) are copied from the 2 h/dose 0 point for better visualization of the changes after 2 h. The surfaces are demonstrated as a grid plot (b) where the grid points indicate one treatment group (n = 3), and a smoothened spline surface plot (c) for easier 3D recognition ((b), (c): Gys2 (glycogen synthase 2, 1424815_ at) showing a typical circadian pattern. (d) the smoothened plots of 6 representative genes/ probe sets generated by Q-PCR (red) and GeneChip (blue). AhR (arylhydrocarbon receptor, 1450695_at) showed imperfect correspondence. Cyp1a1 (cytochrome P450, family 1, subfamily a, polypeptide 1, 1422217_a_at) and Cyp1a2 (1450715_at) showed good correlations between Q-PCR and GeneChip except for the saturation in GeneChips above c. 400 copies per cell. Cyp1b1 (1416612_at) and Cyp7a1 (1422100_at) showed good correspondence. Hspa1a (heat shock protein 1A, 1452888_at) showed fair correspondence despite low copy numbers, near the nominal detection limit of the Affymetrix GeneChip system.
Figure 6
Figure 6
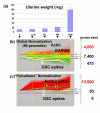
Uterotrophic response of ovariectomized female mice by an estrogenic test compound.(a) Shows the uterine weight, which increases in a dose-dependent manner; V, vehicle control; Low, low dose; ML, medium-low dose; MH, medium-high dose; High, high dose group. (b) Shows the line display of uterine gene expression (Affymetrix MG-U74v2 A GeneChips) normalized by global normalization (90 percentile), and (c) by the Percellome normalization. Averages of three samples per group were visualized (by K. A.). The five white lines are the GSC mRNAs. The green and blue lines are actin (AFFX-b-ActinMur/M12481_3_at) and GAPDH (glyceraldehyde-3-phosphate dehydrogenase, AFFX- GapdhMur/M32599_3_at), respectively. By global normalization, 7,400 probe sets remained unchanged and 4,600 probe sets increased more than two-fold in the H group compared to the V group, whereas almost all probe sets measured had increased. It is noted that housekeeping genes such as actin and GAPDH are significantly induced on a per cell basis.
Figure 7
Figure 7
Conversion functions between Q-PCR and GeneChip. The data shown in Figure 5 as 3D surfaces are shown as a scatter plot (60 plots). The regression function can be used to convert Q-PCR to GeneChip and vice versa, with a level of certainty indicated by coefficient of correlation. It is noted that Cyp1a1 and Cyp1a2 became saturated above about 400 copies per cell in GeneChip system (indicated in pink plots). Cyp7a1 showed high linearity, indicating that the variation shown by the split +1sd and -1sd surfaces in Figure 5 reflected biological (animal) variation, not measurement errors.

Similar articles

Cited by

References

    1. Holstege FC, Jennings EG, Wyrick JJ, Lee TI, Hengartner CJ, Green MR, Golub TR, Lander ES, Young RA. Dissecting the regulatory circuitry of a eukaryotic genome. Cell. 1998;95:717–728. doi: 10.1016/S0092-8674(00)81641-4. - DOI - PubMed
    1. Hill AA, Brown EL, Whitley MZ, Tucker-Kellogg G, Hunter CP, Slonim DK. Evaluation of normalization procedures for oligonucleotide array data based on spiked cRNA controls. Genome Biol. 2001;2 RESEARCH0055. - PMC - PubMed
    1. Lee PD, Sladek R, Greenwood CM, Hudson TJ. Control genes and variability: absence of ubiquitous reference transcripts in diverse mammalian expression studies. Genome Res. 2002;12:292–297. doi: 10.1101/gr.217802. - DOI - PMC - PubMed
    1. van de Peppel J, Kemmeren P, van Bakel H, Radonjic M, van Leenen D, Holstege FC. Monitoring global messenger RNA changes in externally controlled microarray experiments. EMBO Rep. 2003;4:387–393. doi: 10.1038/sj.embor.embor798. - DOI - PMC - PubMed
    1. Yang YH, Dudoit S, Luu P, Lin DM, Peng W, Ngai J, Speed TP. Normalization for cDNA microarray data: a robust composite method addressing single and multiple slide systematic variation. Nucleic Acids Res. 2002;30:e15. doi: 10.1093/nar/30.4.e15. - DOI - PMC - PubMed

Publication types