

Maternal risk profiles and the primary cesarean rate in the United States, 1991-2002
- PMID: 16571712
- PMCID: PMC1470600
- DOI: 10.2105/AJPH.2004.052381
Maternal risk profiles and the primary cesarean rate in the United States, 1991-2002
Abstract
Objectives: We examined factors contributing to shifts in primary cesarean rates in the United States between 1991 and 2002.
Methods: US national birth certificate data were used to assess changes in primary cesarean rates stratified according to maternal age, parity, and race/ethnicity. Trends in the occurrence of medical risk factors or complications of labor or delivery listed on birth certificates and the corresponding primary cesarean rates for such conditions were examined.
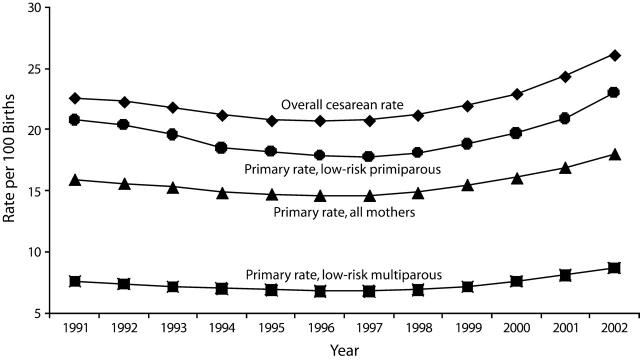
Results: More than half (53%) of the recent increase in overall cesarean rates resulted from rising primary cesarean rates. There was a steady decrease in the primary cesarean rate from 1991 to 1996, followed by a rapid increase from 1996 to 2002. In 2002, more than one fourth of first-time mothers delivered their infants via cesarean. Changing primary cesarean rates were not related to general shifts in mothers' medical risk profiles. However, rates for virtually every condition listed on birth certificates shifted in the same pattern as with the overall rates.
Conclusions: Our results showed that shifts in primary cesarean rates during the study period were not related to shifts in maternal risk profiles.
Figures
References
-
- National Institutes of Health. Cesarean Childbirth. Washington, DC: US Dept of Health and Human Services; 1981. NIH publication 82–2067.
-
- Guidelines for Vaginal Delivery After Previous Cesarean Birth. Washington, DC: American College of Obstetricians and Gynecologists; 1988.
-
- Hamilton BE, Martin JA, Ventura SJ, Sutton PD, Menacker F. Births: preliminary data for 2004. Nat Vital Stat Rep. 2005;54(8):1–17. - PubMed
-
- The National Sentinel Caesarean Section Audit Report. London, England: Royal College of Obstetricians and Gynaecologists, Clinical Effectiveness Support Unit; 2001.
-
- Sachs BP, Kobelin C, Castro MA, Frigoletto F. The risks of lowering the cesarean-delivery rate. N Engl J Med. 1999;340:54–57. - PubMed
MeSH terms
LinkOut - more resources
Full Text Sources
Medical
