. 2006 Dec;96(6):2951-62.
doi: 10.1152/jn.00075.2006. Epub 2006 Mar 29.

Spike-frequency adaptation and intrinsic properties of an identified, looming-sensitive neuron

Affiliations

Spike-frequency adaptation and intrinsic properties of an identified, looming-sensitive neuron

Fabrizio Gabbiani et al. J Neurophysiol. 2006 Dec.

Abstract

We investigated in vivo the characteristics of spike-frequency adaptation and the intrinsic membrane properties of an identified, looming-sensitive interneuron of the locust optic lobe, the lobula giant movement detector (LGMD). The LGMD had an input resistance of 4-5 MOmega, a membrane time constant of about 8 ms, and exhibited inward rectification and rebound spiking after hyperpolarizing current pulses. Responses to depolarizing current pulses revealed the neuron's intrinsic bursting properties and pronounced spike-frequency adaptation. The characteristics of adaptation, including its time course, the attenuation of the firing rate, the mutual dependency of these two variables, and their dependency on injected current, closely followed the predictions of a model first proposed to describe the adaptation of cat visual cortex pyramidal neurons in vivo. Our results thus validate the model in an entirely different context and suggest that it might be applicable to a wide variety of neurons across species. Spike-frequency adaptation is likely to play an important role in tuning the LGMD and in shaping the variability of its responses to visual looming stimuli.


Figures

FIG. 1
FIG. 1
Input resistance of the lobula giant movement detector (LGMD). A: membrane potential hyperpolarization (top) evoked in response to square current pulses (bottom) of −1, −2, and −5 nA, respectively. Each membrane potential trace is an average over 10 stimulus presentations in a single neuron. Two arrowheads indicate the slight sag and rebound activity for the −5-nA current injection, respectively. B: membrane potential depolarization in a single neuron evoked in response to square current pulses of 1, 2, and 3 nA, respectively. In addition to trial averaging as in A, each membrane potential trace was first median-filtered to suppress action potentials. C: histogram of input resistance values derived from A and B for negative and positive current pulses (top and bottom panels, respectively). Negative current pulse data were obtained in 12 neurons (16 different penetrations) and positive current pulse data in 13 neurons (18 different penetrations). D: average input resistance (mean, SD) as a function of injected current derived from the histograms illustrated in C.
FIG. 2
FIG. 2
Membrane time constant of the LGMD. A: membrane potential hyperpolarization (top) to a −5-nA current pulse (bottom). Mean and SD across 10 stimulus repetitions are illustrated by the solid and dotted black lines, respectively. Gray line is a double-exponential fit with 2 time constants, τ = 7.8 ms and τe = 0.3 ms obtained using the peeling method illustrated in B. B: time constant estimation through exponential peeling. Membrane time constant (τ, bottom and left axes) was obtained by fitting the logarithm of the membrane potential minus its minimum steady-state value (black dots) to a straight line (black). τ is the absolute value of the inverse fit line slope. Equalization time constant (τe, top and right axes, gray data points and fit line) was obtained in the same manner, after subtraction of the fitted black straight line [log (vpeel)] from the experimental data. C: histogram of τ values averaged across 3 currents (−1, −2, and −5 nA) obtained in 11 neurons (17 penetrations). D: histogram of values obtained for τe (same data sample as in C). In C and D downward pointing arrows indicate mean τ and τe values, respectively.
FIG. 3
FIG. 3
Inward rectification and poststimulus rebound activity in the LGMD. A: membrane potential deflection in response to negative square current pulses of increasing magnitude (−1 to −12, −15, and −20 nA, respectively). Each trace is averaged across 10 stimulus presentations and was median filtered to suppress rebound spikes. Star, gray circle, and black triangle indicate the peak and end-pulse hyperpolarization as well as the maximum rebound activity to the −20-nA square pulse, respectively. B, top: peak and end-pulse hyperpolarization (star and gray circles, respectively, derived from A) as a function of injected current. Bottom: peak membrane potential post-stimulus rebound (black triangle in A) as a function of injected current. Arrow indicates sudden jump in rebound activity caused by a spike.
FIG. 4
FIG. 4
LGMD bursting in response to depolarizing current pulses. A, top 4 traces: intracellular membrane potential recorded in a single neuron in response to +3-, 4-, 6-, and 10-nA current pulses (bottom), respectively. Action potentials are truncated and only the first 280 ms of the pulse are shown. At threshold (bottom membrane potential trace) the LGMD often fires an isolated action potential. For higher currents (middle 2 traces) one or 2 short bursts of spikes are followed by isolated action potentials. At very high current intensities (top trace), the leading burst merges with the subsequent isolated action potentials and cannot be unambiguously separated from them. Note the increasing temporal separation of action potentials over the course of the pulse (adaptation). B, top: histogram of interspike interval (ISI) duration (≤ 100 ms) over the entire range of currents tested (1–10, 12, 15, and 20 nA) in the neuron illustrated in A. Bottom: histogram of ISI duration (≤ 100 ms) for current pulses leading to ≤ 50 spikes/s mean spike frequency at the end of the pulse (3–10 nA).
FIG. 5
FIG. 5
Adaptation of the LGMD spike frequency during depolarizing current pulses. A: LGMD spiking response to depolarizing current injections of 8, 12, and 15 nA. Top: instantaneous firing frequency of the LGMD [fm(t), black lines] as a function of time (in decreasing order of magnitude). Time zero indicates the positive current pulse onset. Three gray lines are exponential fits to the instantaneous spike frequency. Bottom rasters: spike occurrence times (ticks) for each of the 3 current pulses. Each line corresponds to the neuron’s response to a single current pulse (10 pulses per current value). B: mean instantaneous spike frequency for the first ISI (triangles) and at steady-state (circles) as a function of current magnitude. Gray line is a fit to the spike frequency curve of a leaky integrate-and-fire (LIF) neuron with reset different from rest (see Eq. 1, METHODS; rin5 MΩ, τ = 8 ms, v0 = 62 mV, vth = − 58 mV). C: attenuation factor, Fadap = (f0fss)/f0, as a function of current magnitude. D: time constant of adaptation τadap, derived from exponential fits (A) as a function of current magnitude. E: attenuation factor Fadap, as a function of the adaptation time constant τadap.
FIG. 6
FIG. 6
Adaptation characteristics measured in 13 LGMD neurons. A: mean spike frequency derived from the first ISI and steady-state spike frequency as a function of current amplitude. Data presented as gray lines in AD and marked by black arrows in B and D were obtained from the same 3 neurons. Data from 17 penetrations are illustrated in AD. B: time constant of adaptation as a function of current magnitude. Arrow indicates the single neuron for which the time constant of adaptation decreased with injected current. C: attenuation factor Fadap, as a function of current magnitude. D: attenuation factor Fadap, as a function of adaptation time constant τadap. Arrow indicates the 2 neurons whose curves are slightly offset from the rest of the data. E: steady-state spike frequency slope (derived from A) as a function of spike height. Nine neurons (14 penetrations) are illustrated in E and F. F: spike width as a function of spike height. Vertical and horizontal error bars denote SDs and are sometimes too small to see.
FIG. 7
FIG. 7
Characteristics of the afterhyperpolarization (AHP) in the LGMD. A: plot of the AHP time course after current pulse offset (illustrated by gray area in inset) for depolarizing currents of 1–12 nA. Time zero denotes the time of pulse offset. Each trace is an average across 10 stimulus presentations. Asterisk denotes the peak AHP amplitude for a current pulse of 12 nA. Data plotted in gray were used to prepare C. B: peak AHP (derived from A, star) as a function of current magnitude. C: normalized AHP time course (peak AHP set to one) for currents of 3–12 nA. Dotted black line is the mean across all traces. Black solid line is a single-exponential fit to the dotted black line. D: time constant derived from τadapFadap plots (see Fig. 6D) as a function of the time constant of AHP decay (derived from C) in a sample of 11 neurons (15 penetrations, 28 measurements).
FIG. 8
FIG. 8
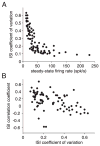
ISI variability and correlation at steady state. A: coefficient of variation of the ISI distribution at steady state as a function of the steady-state spike frequency. B: ISI correlation coefficient as a function of ISI coefficient of variation. Data from 12 different neurons (15 penetrations).
FIG. 9
FIG. 9
Modeling of LGMD adaptation using LIF neuron. Plot of instantaneous spike frequency as a function of time for 3 current pulses (8, 12, and 15 nA, as in Fig. 5A). Time zero denotes positive current pulse onset. Gray lines are exponential fits to the simulated firing rate. Inset: response of the model for an 8-nA current injection.

Similar articles

Cited by

References

    1. Ahmed B, Anderson JC, Douglas RJ, Martin KAC, Whitteridge D. Estimates of the net excitatory currents evoked by visual stimulation of identified neurons in cat visual cortex. Cereb Cortex. 1998;8:462–476. - PubMed
    1. Benda J, Herz AVM. A universal model for spike-frequency adaptation. Neural Comput. 2003;15:2523–2564. - PubMed
    1. Benda J, Longtin A, Maler L. Spike-frequency adaptation separates transient communication signals from background oscillations. J Neurosci. 2005;25:2312–2321. - PMC - PubMed
    1. Bernander Ö, Douglas R, Martin KAC, Koch C. Synaptic background activity influences spatiotemporal integration in single pyramidal cells. Proc Natl Acad Sci USA. 1991;88:11569–11573. - PMC - PubMed
    1. Borg-Gaham L, Monier C, Fregnac Y. Voltage-clamp measurement of visually-evoked conductances with whole-cell patch recordings in primary visual cortex. J Physiol (Paris) 1996;90:185–188. - PubMed

Publication types

Substances

LinkOut - more resources