

Gap junctions among dendrites of cortical GABAergic neurons establish a dense and widespread intercolumnar network
- PMID: 16571750
- PMCID: PMC6673861
- DOI: 10.1523/JNEUROSCI.4076-05.2006
Gap junctions among dendrites of cortical GABAergic neurons establish a dense and widespread intercolumnar network
Abstract
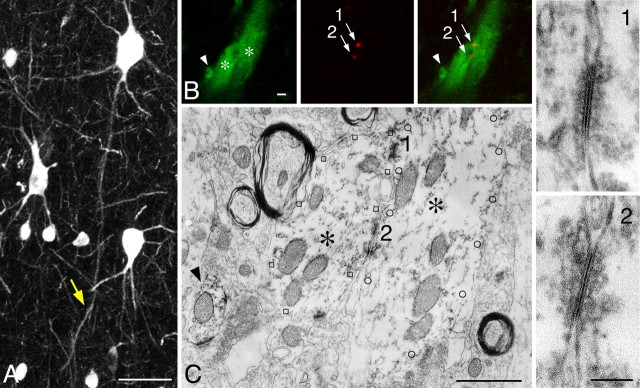
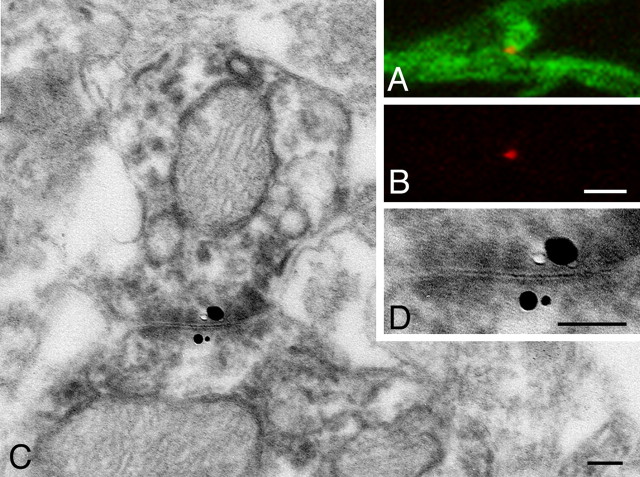
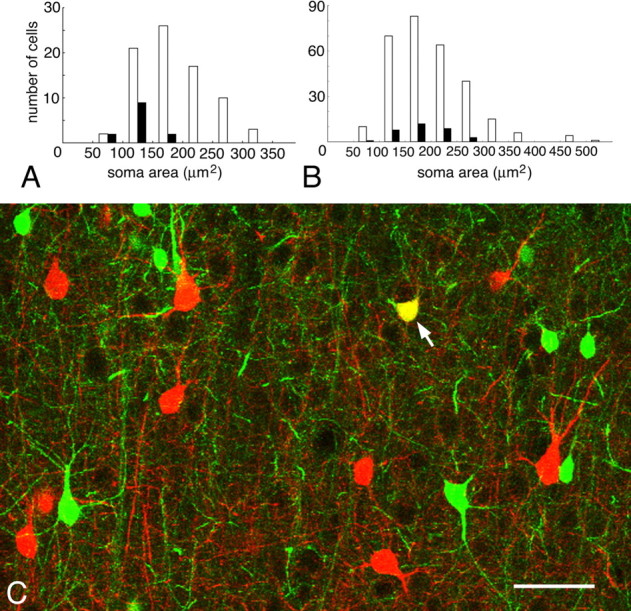
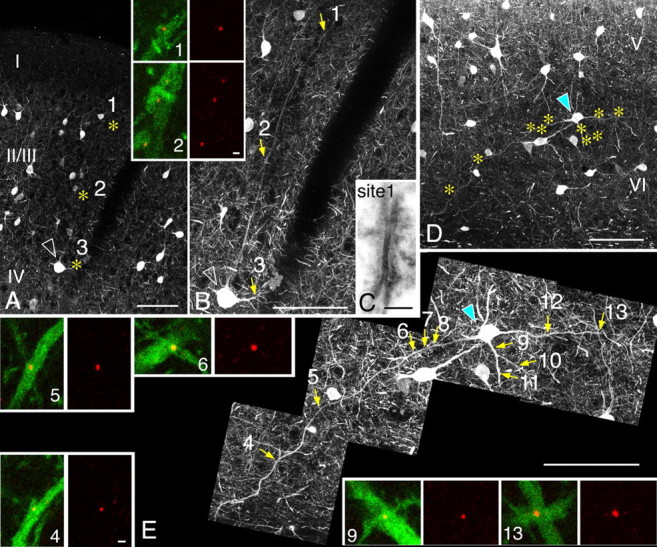
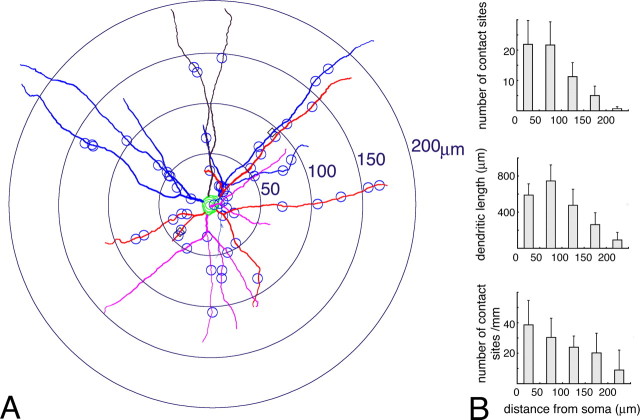
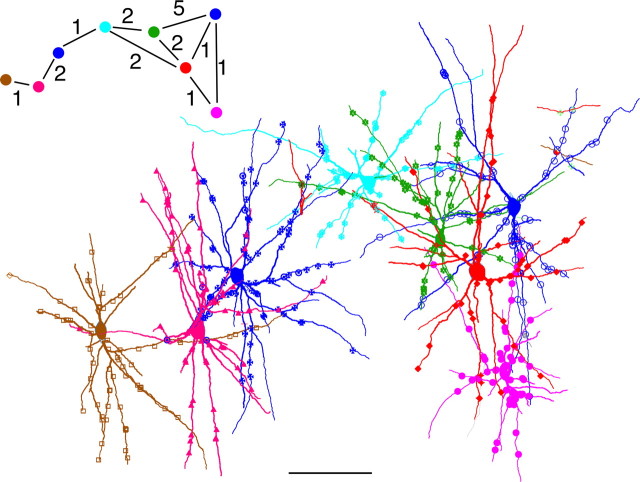
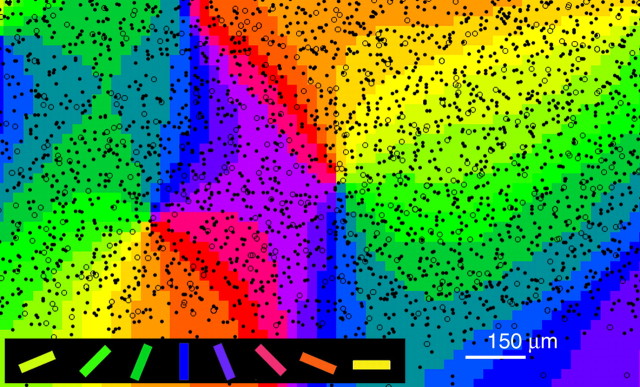
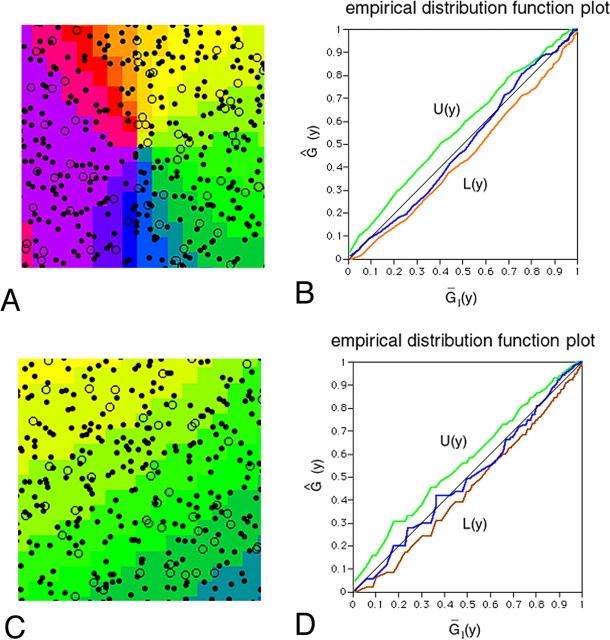
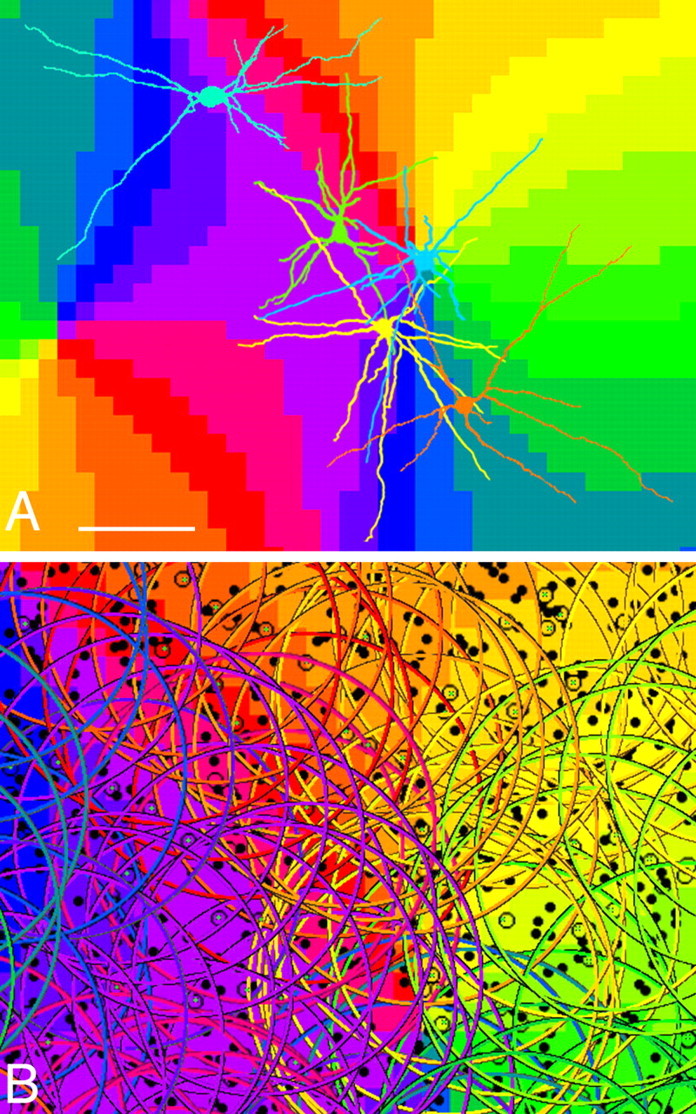
Gap junctions are common between cortical GABAergic interneurons but little is known about their quantitative distribution along dendritic profiles. Here, we provide direct morphological evidence that parvalbumin-containing GABAergic neurons in layer 2/3 of the cat visual cortex form dense and far-ranging networks through dendritic gap junctions. Gap junction-coupled networks of parvalbumin neurons were visualized using connexin36 immunohistochemistry and confocal laser-scanning microscopy (CLSM). The direct correspondence of connexin36-immunopositve puncta and gap junctions was confirmed by examining the same structures in both CLSM and electron microscopy. Single parvalbumin neurons with large somata (> or =200 microm2) formed 60.3 +/- 12.2 (mean +/- SD) gap junctions with other cells whereby these contacts were not restricted to proximal dendrites but occurred at distances of up to 380 microm from the soma. In a Sholl analysis of large-type parvalbumin neurons, 21.9 +/- 7.9 gap junctions were within 50 microm of the soma, 21.7 +/- 7.6 gap junctions in a segment between 50 and 100 microm, 11.2 +/- 4.7 junctions between 100 and 150 microm, and 5.6 +/- 3.6 junctions were in more distal segments. Serially interconnected neurons could be traced laterally in a boundless manner through multiple gap junctions. Comparison to the orientation-preference columns revealed that parvalbumin-immunoreactive cells distribute randomly whereby their large dendritic fields overlap considerably and cover different orientation columns. It is proposed that this dense and homogeneous electrical coupling of interneurons supports the precise synchronization of neuronal populations with differing feature preferences thereby providing a temporal frame for the generation of distributed representations.
Figures
Similar articles
-
Ultrastructural study of gap junctions between dendrites of parvalbumin-containing GABAergic neurons in various neocortical areas of the adult rat.Neuroscience. 2003;120(1):5-20. doi: 10.1016/s0306-4522(03)00328-2. Neuroscience. 2003. PMID: 12849736
-
Structural organization of the dendritic reticulum linked by gap junctions in layer 4 of the visual cortex.Neuroscience. 2017 Jan 6;340:76-90. doi: 10.1016/j.neuroscience.2016.10.050. Epub 2016 Oct 27. Neuroscience. 2017. PMID: 27984185
-
Gap junctions linking the dendritic network of GABAergic interneurons in the hippocampus.J Neurosci. 2000 Feb 15;20(4):1519-28. doi: 10.1523/JNEUROSCI.20-04-01519.2000. J Neurosci. 2000. PMID: 10662841 Free PMC article.
-
Structural organization of the gap junction network in the cerebral cortex.Neuroscientist. 2007 Jun;13(3):199-207. doi: 10.1177/1073858406296760. Neuroscientist. 2007. PMID: 17519363 Review.
-
The dual network of GABAergic interneurons linked by both chemical and electrical synapses: a possible infrastructure of the cerebral cortex.Neurosci Res. 2000 Oct;38(2):123-30. doi: 10.1016/s0168-0102(00)00163-2. Neurosci Res. 2000. PMID: 11000438 Review.
Cited by
-
The robustness of phase-locking in neurons with dendro-dendritic electrical coupling.J Math Biol. 2014 Jan;68(1-2):303-40. doi: 10.1007/s00285-012-0635-5. Epub 2012 Dec 22. J Math Biol. 2014. PMID: 23263302
-
Distinct electrical and chemical connectivity maps in the thalamic reticular nucleus: potential roles in synchronization and sensation.J Neurosci. 2006 Aug 16;26(33):8633-45. doi: 10.1523/JNEUROSCI.2333-06.2006. J Neurosci. 2006. PMID: 16914689 Free PMC article.
-
Thalamocortical Circuits and Functional Architecture.Annu Rev Vis Sci. 2018 Sep 15;4:263-285. doi: 10.1146/annurev-vision-091517-034122. Epub 2018 Jun 1. Annu Rev Vis Sci. 2018. PMID: 29856937 Free PMC article. Review.
-
Nociceptive afferent activity alters the SI RA neuron response to mechanical skin stimulation.Cereb Cortex. 2010 Dec;20(12):2900-15. doi: 10.1093/cercor/bhq039. Epub 2010 Mar 22. Cereb Cortex. 2010. PMID: 20308203 Free PMC article.
-
Introduction to the CLEM technique developed in the field of neuroanatomy.Anat Sci Int. 2025 Jul 23. doi: 10.1007/s12565-025-00875-w. Online ahead of print. Anat Sci Int. 2025. PMID: 40699295
References
-
- Beierlein M, Gibson JR, Connors BW (2000). A network of electrically coupled interneurons drives synchronized inhibition in neocortex. Nat Neurosci 3:904–910. - PubMed
-
- Blatow M, Rozov A, Katona I, Hormuzdi SG, Meyer AH, Whittington MA, Caputi A, Monyer H (2003). A novel network of multipolar bursting interneurons generates theta frequency oscillations in neocortex. Neuron 38:805–817. - PubMed
Publication types
MeSH terms
Substances
LinkOut - more resources
Full Text Sources
Other Literature Sources
Miscellaneous