

Neural representation of object approach in a decision-making motor circuit
- PMID: 16571752
- PMCID: PMC6673849
- DOI: 10.1523/JNEUROSCI.5259-05.2006
Neural representation of object approach in a decision-making motor circuit
Abstract
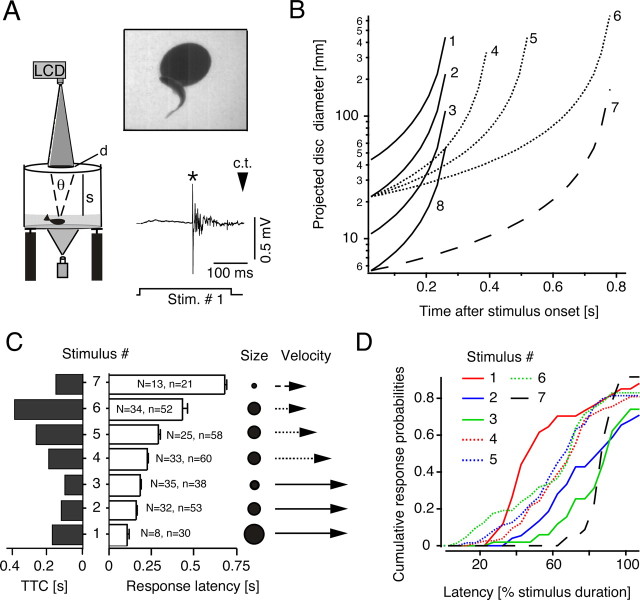
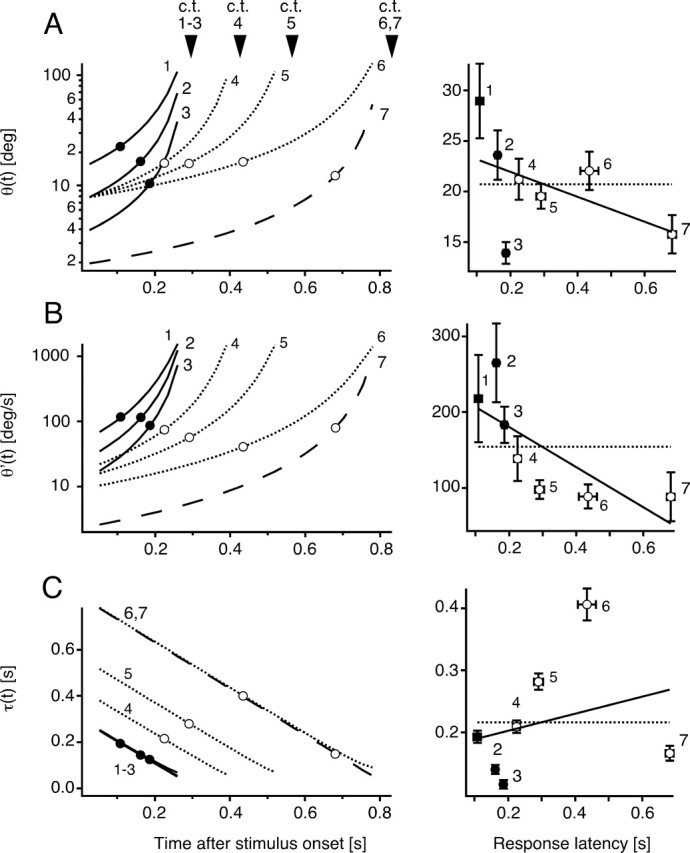
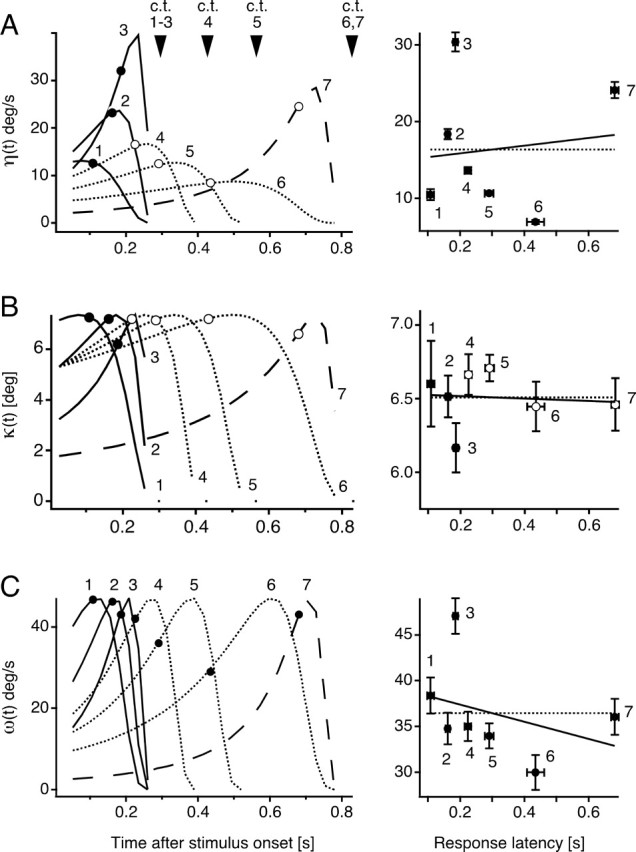
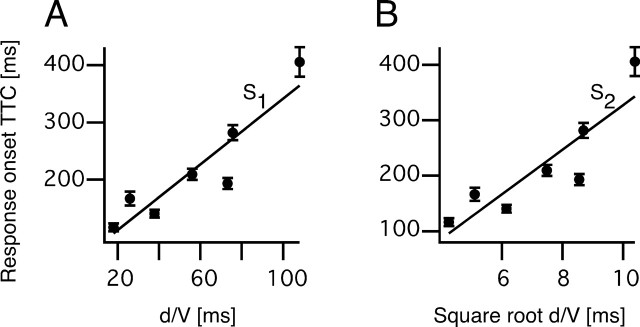
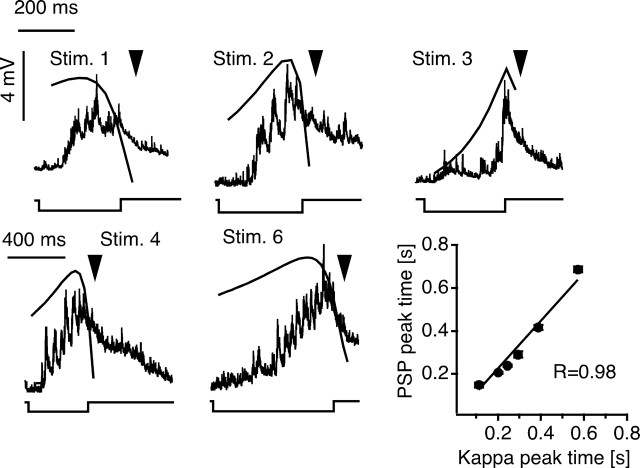
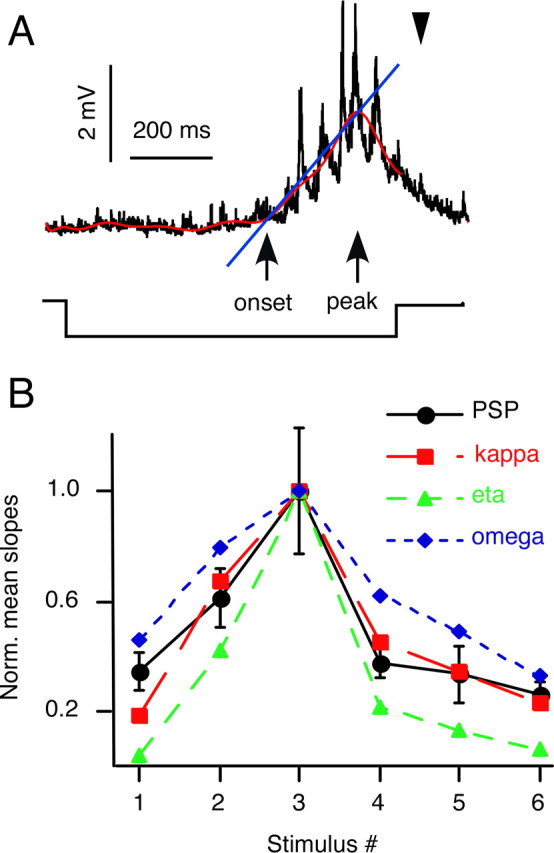
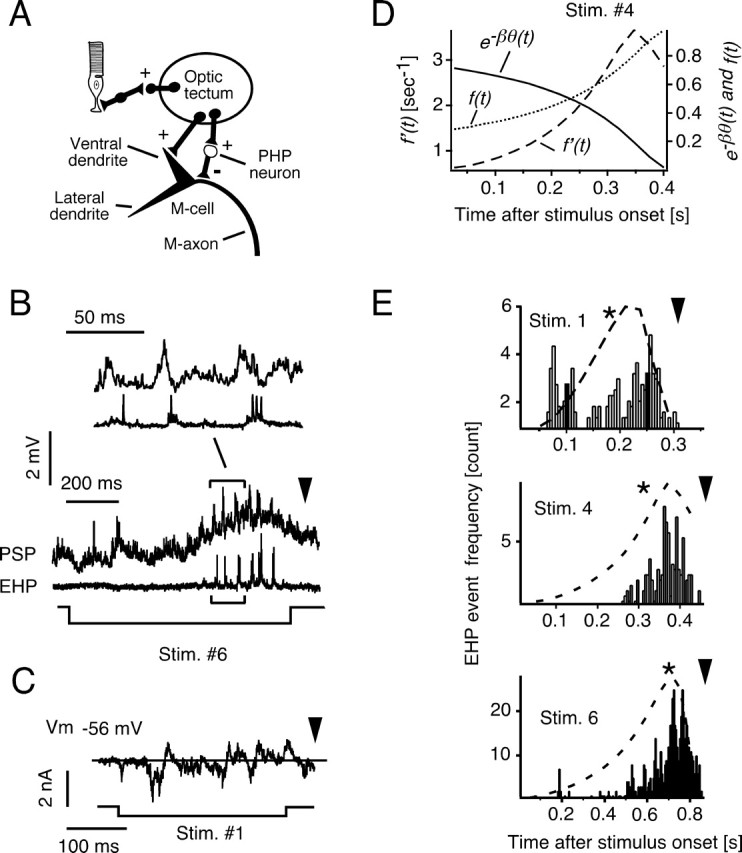
Although behavior is ultimately guided by decision-making neurons and their associated networks, the mechanisms underlying neural decision-making in a behaviorally relevant context remain mostly elusive. To address this question, we analyzed goldfish escapes in response to distinct visual looming stimuli with high-speed video and compared them with electrophysiological responses of the Mauthner cell (M-cell), the threshold detector that initiates such behaviors. These looming stimuli evoke powerful and fast body-bend (C-start) escapes with response probabilities between 0.7 and 0.91 and mean latencies ranging from 142 to 716 ms. Chronic recordings showed that these C-starts are correlated with M-cell activity. Analysis of response latency as a function of the different optical parameters characterizing the stimuli suggests response threshold is closely correlated to a dynamically scaled function of angular retinal image size, (t), specifically kappa(t) = (t-delta x e(-beta(t-delta)), where the exponential term progressively reduces the weight of (t). Intracellular recordings show that looming stimuli typically evoked bursts of graded EPSPs with peak amplitudes up to 9 mV in the M-cell. The proposed scaling function kappa(t) predicts the slope of the depolarizing envelope of these EPSPs and the timing of the largest peak. An analysis of the firing rate of presynaptic inhibitory interneurons suggests the timing of the EPSP peak is shaped by an interaction of excitatory and inhibitory inputs to the M-cell and corresponds to the temporal window in which the probabilistic decision of whether or not to escape is reached.
Figures
Similar articles
-
Synchronous bursting in a subset of interneurons inhibitory to the goldfish Mauthner cell: synaptic mediation and plasticity.J Neurophysiol. 1994 Aug;72(2):531-41. doi: 10.1152/jn.1994.72.2.531. J Neurophysiol. 1994. PMID: 7983517
-
Central cellular mechanisms underlying temperature-dependent changes in the goldfish startle-escape behavior.J Neurosci. 2003 Jul 2;23(13):5617-26. doi: 10.1523/JNEUROSCI.23-13-05617.2003. J Neurosci. 2003. PMID: 12843264 Free PMC article.
-
Behavioral and physiological characterization of sensorimotor gating in the goldfish startle response.J Neurophysiol. 2008 Mar;99(3):1493-502. doi: 10.1152/jn.00959.2007. Epub 2008 Jan 16. J Neurophysiol. 2008. PMID: 18199818
-
Neuronal networks underlying the escape response in goldfish. General implications for motor control.Ann N Y Acad Sci. 1989;563:11-33. doi: 10.1111/j.1749-6632.1989.tb42187.x. Ann N Y Acad Sci. 1989. PMID: 2672948 Review. No abstract available.
-
Role of medullary networks and postsynaptic membrane properties in regulating Mauthner cell responsiveness to sensory excitation.Brain Behav Evol. 1991;37(5):286-97. doi: 10.1159/000114366. Brain Behav Evol. 1991. PMID: 1657272 Review.
Cited by
-
Neural circuits underlying habituation of visually evoked escape behaviors in larval zebrafish.Elife. 2023 Mar 14;12:e82916. doi: 10.7554/eLife.82916. Elife. 2023. PMID: 36916795 Free PMC article.
-
A role of electrical inhibition in sensorimotor integration.Proc Natl Acad Sci U S A. 2008 Nov 18;105(46):18047-52. doi: 10.1073/pnas.0806145105. Epub 2008 Nov 12. Proc Natl Acad Sci U S A. 2008. PMID: 19004764 Free PMC article.
-
The goldfish Carassius auratus: an emerging animal model for comparative cardiac research.J Comp Physiol B. 2022 Jan;192(1):27-48. doi: 10.1007/s00360-021-01402-9. Epub 2021 Aug 28. J Comp Physiol B. 2022. PMID: 34455483 Free PMC article. Review.
-
Selenomethionine reduces visual deficits due to developmental methylmercury exposures.Physiol Behav. 2008 Jan 28;93(1-2):250-60. doi: 10.1016/j.physbeh.2007.08.023. Epub 2007 Sep 5. Physiol Behav. 2008. PMID: 17905328 Free PMC article.
-
Phase encoding in the Mauthner system: implications in left-right sound source discrimination.J Neurosci. 2009 Mar 18;29(11):3431-41. doi: 10.1523/JNEUROSCI.3383-08.2009. J Neurosci. 2009. PMID: 19295149 Free PMC article.
References
-
- Arnott SA, Neil DM, Ansell AD (1999). Escape trajectories of the brown shrimp Crangon Crangon, and a theoretical consideration of initial escape angles from predators. J Exp Biol 202:193–209. - PubMed
-
- Batty RS (1989). Escape responses of herring larvae to visual stimuli. J Mar Biol Ass UK 69:647–654.
-
- Canfield JG (2003). Temporal constraints on visually directed C-start responses: behavioral and physiological correlates. Brain Behav Evol 61:148–158. - PubMed
-
- Dill LW (1974). The escape response of the zebra danio (Brachydanio Rerio) I. The stimulus for escape. Anim Behav 22:711–722.
-
- Driver PM, Humphries DA (1988). In: Protean behaviour: the biology of unpredictability Oxford: Clarendon.
Publication types
MeSH terms
Grants and funding
LinkOut - more resources
Full Text Sources