. 2006 Mar 29;26(13):3567-83.
doi: 10.1523/JNEUROSCI.5050-05.2006.

Competition between feedback loops underlies normal and pathological dynamics in the basal ganglia

Affiliations

Competition between feedback loops underlies normal and pathological dynamics in the basal ganglia

Arthur Leblois et al. J Neurosci. .

Abstract

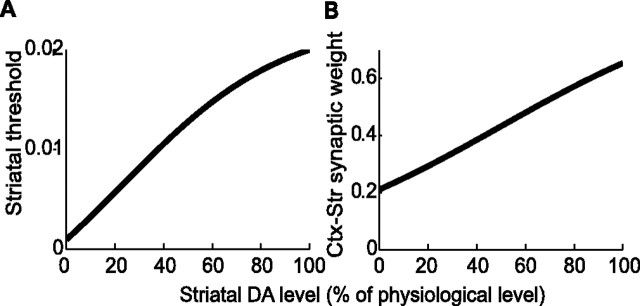
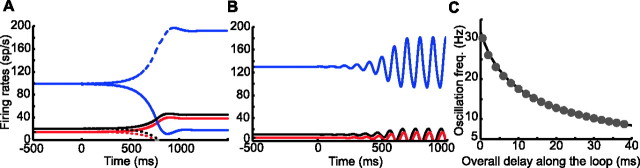
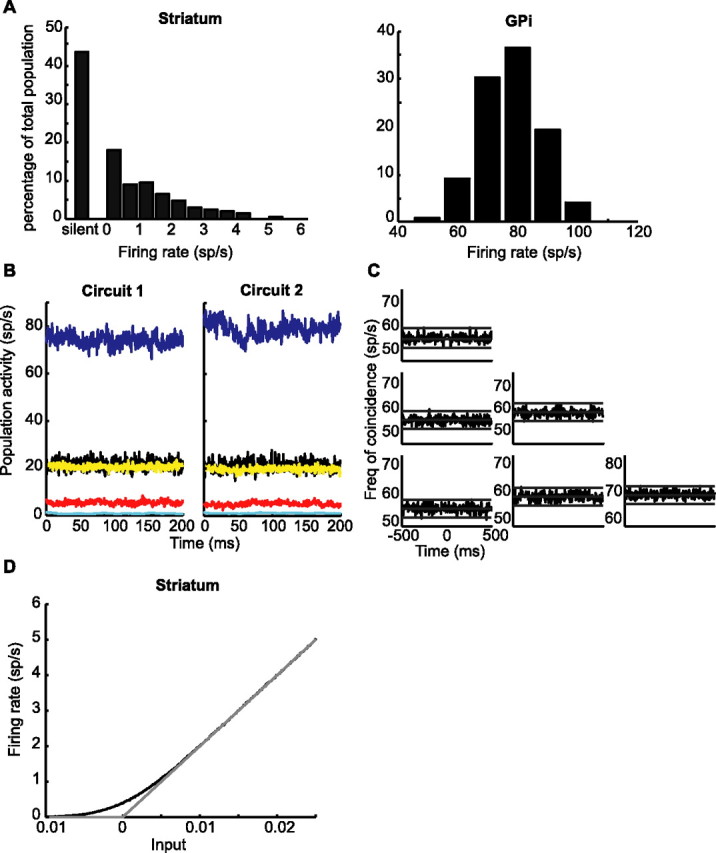
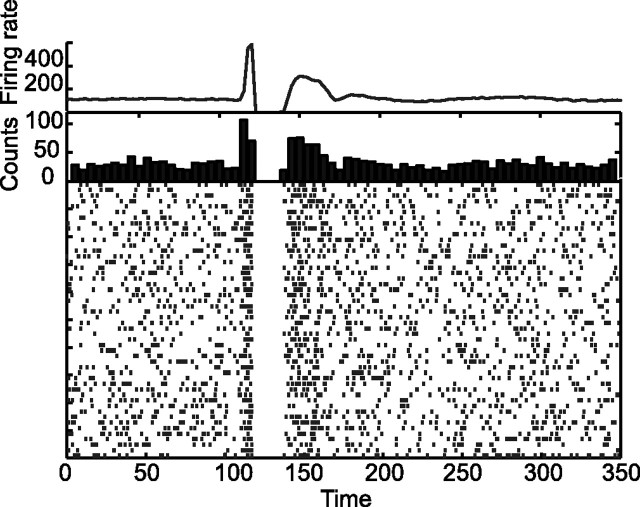
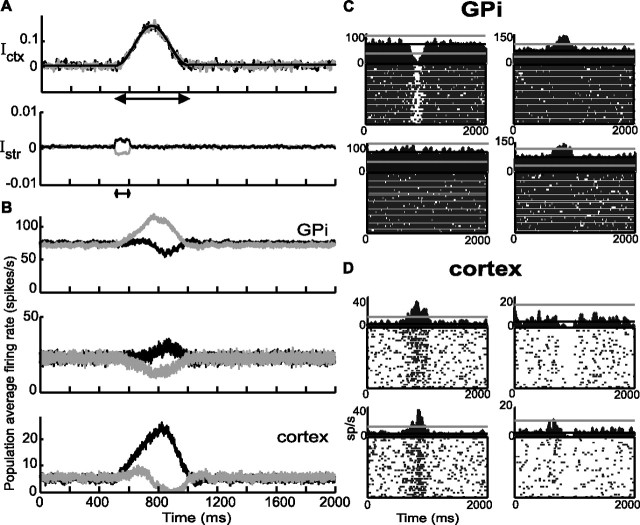
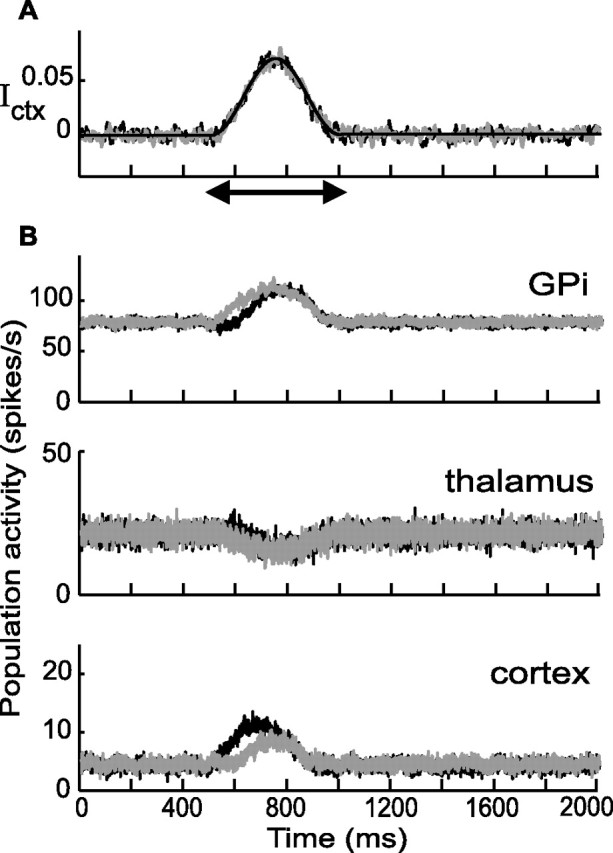
Experiments performed in normal animals suggest that the basal ganglia (BG) are crucial in motor program selection. BG are also involved in movement disorders. In particular, BG neuronal activity in parkinsonian animals and patients is more oscillatory and more synchronous than in normal individuals. We propose a new model for the function and dysfunction of the motor part of BG. We hypothesize that the striatum, the subthalamic nucleus, the internal pallidum (GPi), the thalamus, and the cortex are involved in closed feedback loops. The direct (cortex-striatum-GPi-thalamus-cortex) and the hyperdirect loops (cortex-subthalamic nucleus-GPi-thalamus-cortex), which have different polarities, play a key role in the model. We show that the competition between these two loops provides the BG-cortex system with the ability to perform motor program selection. Under the assumption that dopamine potentiates corticostriatal synaptic transmission, we demonstrate that, in our model, moderate dopamine depletion leads to a complete loss of action selection ability. High depletion can lead to synchronous oscillations. These modifications of the network dynamical state stem from an imbalance between the feedback in the direct and hyperdirect loops when dopamine is depleted. Our model predicts that the loss of selection ability occurs before the appearance of oscillations, suggesting that Parkinson's disease motor impairments are not directly related to abnormal oscillatory activity. Another major prediction of our model is that synchronous oscillations driven by the hyperdirect loop appear in BG after inactivation of the striatum.


Figures

Figure 1.
Figure 1.
Architecture of the model. The network consists of two circuits, each comprising a cortical, a striatal, a thalamic, a subthalamic, and a pallidal population. The two circuits interact via diffused subthalamic–pallidal connections. Arrows, Excitatory connections. Dots, Inhibitory connections. The substancia nigra pars compacta is not explicitly represented in the model.
Figure 2.
Figure 2.
The effects of DA. A, The effect on the threshold of striatal neurons (Eq. 10). B, The effect on the effective strength of the corticostriatal synapses (Eq. 11). D = 100% corresponds to the “normal” physiological level of DA.
Figure 3.
Figure 3.
Instabilities of the symmetric fixed point solution of Equations 12345–6. In A and B, the network settles at the unstable symmetric fixed point at t = −500 ms. It remains there until t = 0 when the cortical population in circuit 1 is perturbed by a brief external current. After a short while, an instability develops. Red, Cortex; black, thalamus; blue, GPi. Solid (resp. dashed) lines, The activities in circuit 1 (resp. circuit 2). A, Symmetry-breaking instability for G+ = 2.47, G = 2.85. The network ends in an asymmetric state in which the cortical population is active in one circuit alone. B, Oscillatory instability for G+ = 0.18 and G = 2.85. The network settles in a homogeneous oscillatory state. C, Solid line, The frequency of the unstable mode at instability onset as a function of the overall delay Δ derived from Equation 36. Circles, The frequency of the oscillations as a function of Δ at the instability onset for G = 2.85.
Figure 4.
Figure 4.
The phase diagram for the various dynamical regimens of the reduced model as a function of G+ and G for Γ = 0.4, Δ+ = 26 ms and Δ = 20 ms. The synaptic time constant is τ = 5 ms for all of the synapses except synapses from the cortex to STN for which τSTNCtx = 20 ms.
Figure 5.
Figure 5.
The responses of the reduced network model to a weakly and transiently selective external input in the various regimens of the phase diagram. Network parameters are given in Table 1. Activities in and inputs to circuit 1 (resp. circuit 2) are plotted with solid lines (resp. dashed lines). A, The external input. Top, The input to the cortical populations in the two circuits. Bottom, The input to the striatum. The responses of the cortex (red), the thalamus (black), and the GPi (blue) are plotted in B, the symmetry-breaking regimen (GStrCtx = 0.7); C, the linear regimen (GStrCtx = 0.4); and D, the oscillatory regimen (GStrCtx = 0.05). Note that only one cortical population is activated in the symmetry-breaking regimen (B), whereas both populations are activated in the other regimens. E, The response of the network to a strong cortical input in the oscillatory regimen (GStrCtx = 0.05). The striatal input and the profile of the cortical input are as in A. The amplitude of the latter has been increased by a factor of 3. The oscillation is suppressed because the thalamus is silent, and subsequently the feedback loops are open. F, The response of the network to the input displayed in A in the multistability regimen (GStrCtx = 0.9). As in the symmetry-breaking regimen, one cortical population is activated, whereas the other is silent.
Figure 6.
Figure 6.
Neuronal activities in the network at rest. A, The distributions of the average spontaneous firing rates of striatal and GPi neurons. B, Population activities of groups of 20 neurons randomly chosen in the GPi (blue lines), the thalamus (black lines), the STN (yellow lines), the cortex (red lines), and the striatum (cyan lines). C, Correlation matrix of three GPi neurons. Diagonal, Autocorrelograms. Off-diagonal, Cross-correlations. D, The effective input–output transfer function of a neuron in the striatum in the absence (gray line) and in the presence of noise (black line, SD of the noise given in Table 1). In the presence of noise and for low input, the effective gain of striatal neurons is reduced.
Figure 7.
Figure 7.
Neuronal response in the GPi after a cortical stimulation in the normal state (D = 100%). At t = 100 ms, a brief excitatory stimulation, lasting 5 ms, is applied to the cortex. From top to bottom, population activity averaged over 20 neurons in GPi, PETH of one GPi neuron aligned on the cortical stimulation (30 repetitions), and the corresponding raster plots are shown. The response of the GPi is triphasic.
Figure 8.
Figure 8.
Action selection in the normal situation (D = 100%). A, Top, In gray, the nonselective external input to the cortex. In black, average over 100 trials of the input. The input is zero outside the double arrow. The bell shape is given by Equation 7 with ϵ = 0, H1Ctx = 0.15, tm = 750 ms, and Dmvt = 500 ms. Bottom, The transient and weakly selective input to the striatal population in circuit 1 (black) and circuit 2 (gray) (Eq. 9 with HStr = 0.001). B, Activities averaged over a population of 20 neurons in GPi (top), thalamus (middle), and cortex (bottom) in response to the input depicted in A. Black, Circuit 1; gray, circuit 2. C, PETH of four units in GPi. D, Four units in the cortex. In C and D, Left (top and bottom), circuit 1; right, circuit 2.
Figure 9.
Figure 9.
Activities in GPi and cortex as a function of the DA level. A, Population activities in GPi (left) and in cortex (right). The activities are averaged over 20 neurons chosen at random in the GPi or cortex in the two circuits and over 10 trials. The activity was averaged over a 200 ms window starting 200 ms after the input onset (see Materials and Methods). Solid lines, Rest state. Dashed lines, Activities in response to the input plotted in Figure 8A. The average striatal threshold and strength of corticostriatal synapses are given by Equations 10 and 11 for the solid and dashed lines. Dashed dotted line, Rest state for constant average striatal threshold. The strength of corticostriatal synapses is still given by Equation 11, but the average threshold of striatal neurons is TStr = −0.02 and no longer depends on the level of DA. Note that the GPi average rest activity is increasing with DA depletion in this case. B, Population activities (20 neurons; 10 trials) in response to the input of Figure 8A. Left, GPi; right, cortex. Black, Circuit 1; gray, circuit 2. In the normal condition (D = 100%), symmetry breaking occurs and the activities in the two circuits are different. As DA is depleted, this difference diminishes and symmetry is restored for D ≈ 70%.
Figure 10.
Figure 10.
Response of the network after partial DA depletion (D = 70%). A, The external input is the same as in Figure 8A (striatal input not shown). B, The population activity of a group of 20 neurons in GPi (top panel), thalamus (middle panel), and cortex (bottom panel). Black, Circuit 1; gray, circuit 2. The transient selective input to the striatum induces a small difference in the activities of the two circuits. This difference disappears after the selective input to the striatum is over.
Figure 11.
Figure 11.
Rest activity in the GPi after strong DA depletion (D = 20%). A, Top, The population activity (averaged over 20 neurons) in the GPi displays oscillations with a frequency ∼11 Hz. Bottom, Raster plots for the spike trains of the 20 units in the top figure. B, Correlation matrix of the spike trains of three units in GPi. Diagonal, Autocorrelations. Off-diagonal, Cross-correlations (see Materials and Methods). C, The distribution of the average firing rates of GPi neurons for D = 20%. Despite the dramatic change in the pattern of neuronal activity, the time average distribution does not change greatly after DA depletion [compare with the distribution in the normal situation (Fig. 6A)].
Figure 12.
Figure 12.
Response of the network to external inputs in the high DA depletion condition, D = 20%. Black, Circuit 1; gray, circuit 2. In A–C, from top to bottom, the input to the cortical populations and the average population activities (20 neurons) in the GPi, the thalamus, and the cortex are shown. The input to striatal neurons is always the same as in Figure 8. A, The external input is slightly selective as in Figure 8A. Oscillatory activities occur in the three populations represented. During input, activity in both cortical populations increases only slightly. B, The external input to the cortex, which is three time larger than in A, is plotted in the top panel. The thalamus is strongly inhibited during input. The oscillatory activity in the network is suppressed. C, Response to the large and strongly selective input to the cortex (ϵ = 0.6) plotted in the top panel. Oscillations are stopped and selectivity is trivially restored. D, Effective input–output transfer function of neurons in the thalamus in presence of noise (black, SD of the noise given in Table 1). For comparison, the function without noise is plotted in gray.
Figure 13.
Figure 13.
Activity pattern and response to action execution in the GPi during progressive DA depletion. A, Ratio of GPi neurons that are inhibited during action execution for several levels of striatal DA. Action selection in the model relies on the bimodal response to action execution in the GPi (one population is inhibited, whereas the other is activated). The decrease in the proportion of inhibited neurons in the GPi in response to movement reflects the loss of action selection properties that occur for low DA depletion. B, Ratio of oscillatory autospectra and coherence for several levels of striatal DA in the model. For each DA level, the spectral analysis is applied to 40 GPi units (see Materials and Methods). The emergence of synchronized oscillatory activity occurs only after high DA depletion.

Comment in

Similar articles

Cited by

References

    1. Aizman O, Brismar H, Uhlen P, Zettergren E, Levey AI, Forssberg H, Greengard P, Aperia A (2000). Anatomical and physiological evidence for D1 and D2 dopamine receptor colocalization in neostriatal neurons. Nat Neurosci 3:226–230. - PubMed
    1. Albin RL, Young AB, Penney JB (1989). The functional anatomy of basal ganglia disorders. Trends Neurosci 12:366–375. - PubMed
    1. Alexander GE, DeLong MR, Strick PL (1986). Parallel organization of functionally segregated circuits linking basal ganglia and cortex. Annu Rev Neurosci 9:357–381. - PubMed
    1. Apicella P, Ljungberg T, Scarnati E, Schultz W (1991). Responses to reward in monkey dorsal and ventral striatum. Exp Brain Res 85:491–500. - PubMed
    1. Baker SN, Gerstein GL (2001). Determination of response latency and its application to normalization of cross-correlation measures. Neural Comput 13:1351–1377. - PubMed

Publication types

LinkOut - more resources